Centralized logging is one of the essential part in Kubernetes environment. In this tutorial, we will deploy Elasticsearch, Fluend and Kibana with Helm chart for logging.
Elasticsearch is a scalable search engine which is mainly used to index and search within the vast volumes of log data.
Fluentd collects the data from pods and nodes (deployed in each nodes via daemonsets) and transform and ship the logs to the Elasticsearch.
Finally, Kibana, which is a powerful data visualization tool for Elasticsearch used to explore elasticsearch log data through the web interface.
Prerequisite
- Minimum 4-6 GB free memory in each nodes
- Dynamic storage provisioning
- MetalLB (only for bare metal. A load balancer service for Kubernetes)
Preparing environment
For this tutorial, I will use 1 master and 3 worker nodes cluster deployed in bare metal (LXC containers). You can find the lxd provisioning script in my repo. Also, for dynamic storage provisioning, I will use NFS in order to create storage on demand. You can follow my other guide on how to setup dynamic NFS provisioning in Kubernetes with Helm 3
After setting up dynamic nfs provisioning, it’s time to setup MetalLB (Kubernetes load balancer for bare metal). Please note, if you are following this tutorial in bare metal/your host machine, you need to setup a load balancer (LB) for your local cluster. For cloud, you don’t need to setup any LB.
Setting up MetalLB load balancer for bare metal
By default, Kubernetes does not offer load-balancers for bare metal clusters. MetalLB solves this issue by providing a LB for the local cluster. By using MetalLB, it is possible to access the service with LoadBalancer service type.
To setup the MetalLB, run the following manifest found here
After that, you will find the resources are deployed in metallb-system namespace
$ kubectl get all -n metallb-system

NAME                              READY   STATUS    RESTARTS   AGE
pod/controller-64f86798cc-4jvj8   1/1     Running   2          38h
pod/speaker-2grh5                 1/1     Running   2          38h
pod/speaker-4xdb6                 1/1     Running   2          38h
pod/speaker-m7hzx                 1/1     Running   2          38h
pod/speaker-ng9ng                 1/1     Running   2          38h

NAME                     DESIRED   CURRENT   READY   UP-TO-DATE   AVAILABLE   NODE SELECTOR            AGE
daemonset.apps/speaker   4         4         4       4            4           kubernetes.io/os=linux   38h

NAME                         READY   UP-TO-DATE   AVAILABLE   AGE
deployment.apps/controller   1/1     1            1           38h

NAME                                    DESIRED   CURRENT   READY   AGE
replicaset.apps/controller-64f86798cc   1         1         1       38h```
Now, create metallb-config.yaml and paste the following
apiVersion: v1
kind: ConfigMap
metadata:
  namespace: metallb-system
  name: config
data:
  config: |
    address-pools:
    - name: default
      protocol: layer2
      addresses:
      - 10.116.200.220-10.116.200.250
At line 12, replace the first three parts of the IP address range according to your cluster node. For example, my cluster IP addresses start with 10.116.200.X
 deploy the resource
$ kubectl create -f metallb-config.yaml
Testing
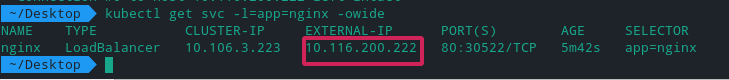
$ kubectl create deploy nginx --image=nginx
$ kubectl expose deploy nginx --port 80 --type LoadBalancer
You should see an External IP assigned by LB and application should be accessible with this IP.
 MetalLB setup part is done✌️
Setup EFK stack
Elasticsearch
Now we will deploy elasticsearch in our cluster. However before start, make sure you deployed dynamic storage provisioning in your cluster. Elasticsearch will create persistent volume automatically to store its persistent data.
First, we need to add elastic helm repo in our environment
helm repo add elastic https://helm.elastic.co
helm repo update
Next, get the values.yaml from here. We will modify the value according to our need. Removing all the entries in values.yaml and paste the following entries. Rename the file with esvalues.yaml :
---
protocol: http
httpPort: 9200
transportPort: 9300

service:
  labels: {}
  labelsHeadless: {}
  type: LoadBalancer
  nodePort: ""
  annotations: {}
  httpPortName: http
  transportPortName: transport
  loadBalancerIP: ""
  loadBalancerSourceRanges: []
  externalTrafficPolicy: ""
Here we changed the type: ClusterIP to type: LoadBalancer. We are exposing the elasticsearch service externally so that other services can access.
Install elasticsearch version 7.13.0 with custom values
helm install elasticsearch --version 7.13.0 elastic/elasticsearch -f esvalues.yaml
Wait for few minutes. After that, you should see all the resources are up and running. Note the elasticsearch service’s external IP. In my case it is 10.116.200.220.
$ kubectl get all -l=chart=elasticsearch

NAME                         READY   STATUS    RESTARTS   AGE
pod/elasticsearch-master-0   1/1     Running   1          30m
pod/elasticsearch-master-1   1/1     Running   1          30m
pod/elasticsearch-master-2   1/1     Running   1          30m

NAME                                    TYPE           CLUSTER-IP      EXTERNAL-IP      PORT(S)                         AGE
service/elasticsearch-master            LoadBalancer   10.111.144.67   10.116.200.220   9200:32713/TCP,9300:30001/TCP   16h
service/elasticsearch-master-headless   ClusterIP      None            <none>           9200/TCP,9300/TCP               16h```
PV and PVC are also deployed for elasticsearch
$ kubectl get pv,pvc
NAME                                                        CAPACITY   ACCESS MODES   RECLAIM POLICY   STATUS   CLAIM                                                 STORAGECLASS   REASON   AGE
persistentvolume/pvc-78903930-6315-4b6d-989d-1bf348fcd52a   30Gi       RWO            Delete           Bound    default/elasticsearch-master-elasticsearch-master-2   nfs-client              30m
persistentvolume/pvc-f602f084-4311-4c08-b259-bd1075b9f093   30Gi       RWO            Delete           Bound    default/elasticsearch-master-elasticsearch-master-1   nfs-client              30m
persistentvolume/pvc-f7759e35-1b0e-4b2b-ba56-a02d55a78fe3   30Gi       RWO            Delete           Bound    default/elasticsearch-master-elasticsearch-master-0   nfs-client              30m

NAME                                                                STATUS   VOLUME                                     CAPACITY   ACCESS MODES   STORAGECLASS   AGE
persistentvolumeclaim/elasticsearch-master-elasticsearch-master-0   Bound    pvc-f7759e35-1b0e-4b2b-ba56-a02d55a78fe3   30Gi       RWO            nfs-client     30m
persistentvolumeclaim/elasticsearch-master-elasticsearch-master-1   Bound    pvc-f602f084-4311-4c08-b259-bd1075b9f093   30Gi       RWO            nfs-client     30m
persistentvolumeclaim/elasticsearch-master-elasticsearch-master-2   Bound    pvc-78903930-6315-4b6d-989d-1bf348fcd52a   30Gi       RWO            nfs-client     30m
Also note down the image id of the elasticsearch container. In should be 7.13.0
$ kubectl describe pods elasticsearch-master-0 | grep -i image

    Image:         docker.elastic.co/elasticsearch/elasticsearch:7.13.0
The image id is important to remember because this version/id should be same for Kibana which we will deploy later.
Fluentd
Next we will setup fluentd in the cluster. Fluentd will be deployed as daemonset so that it can run in each nodes and collect the pods and nodes logs. Also we need to deploy rbac and service account for fluentd. So get the full manifest from here
Again I’ve modified the manifest values according to my need. Let’s see the final values. Paste the following snippet in fluentd-ds-rbac.yaml file
---
apiVersion: v1
kind: ServiceAccount
metadata:
  name: fluentd
  namespace: kube-system

---
apiVersion: rbac.authorization.k8s.io/v1
kind: ClusterRole
metadata:
  name: fluentd
  namespace: kube-system
rules:
- apiGroups:
  - ""
  resources:
  - pods
  - namespaces
  verbs:
  - get
  - list
  - watch

---
kind: ClusterRoleBinding
apiVersion: rbac.authorization.k8s.io/v1
metadata:
  name: fluentd
roleRef:
  kind: ClusterRole
  name: fluentd
  apiGroup: rbac.authorization.k8s.io
subjects:
- kind: ServiceAccount
  name: fluentd
  namespace: kube-system
---
apiVersion: apps/v1
kind: DaemonSet
metadata:
  name: fluentd
  namespace: kube-system
  labels:
    k8s-app: fluentd-logging
    version: v1
spec:
  selector:
    matchLabels:
      k8s-app: fluentd-logging
      version: v1
  template:
    metadata:
      labels:
        k8s-app: fluentd-logging
        version: v1
    spec:
      serviceAccount: fluentd
      serviceAccountName: fluentd
      tolerations:
      - key: node-role.kubernetes.io/master
        effect: NoSchedule
      containers:
      - name: fluentd
        image: fluent/fluentd-kubernetes-daemonset:v1-debian-elasticsearch
        env:
          - name:  FLUENT_ELASTICSEARCH_HOST
            value: "10.116.200.220"
          - name:  FLUENT_ELASTICSEARCH_PORT
            value: "9200"
          - name: FLUENT_ELASTICSEARCH_SCHEME
            value: "http"
          # Option to configure elasticsearch plugin with self signed certs
          # ================================================================
          - name: FLUENT_ELASTICSEARCH_SSL_VERIFY
            value: "true"
          # Option to configure elasticsearch plugin with tls
          # ================================================================
          - name: FLUENT_ELASTICSEARCH_SSL_VERSION
            value: "TLSv1_2"
          # X-Pack Authentication
          # =====================
          - name: FLUENT_ELASTICSEARCH_USER
            value: "elastic"
          - name: FLUENT_ELASTICSEARCH_PASSWORD
            value: "changeme"
          # If you don't setup systemd in the container, disable it
          # =====================
          - name: FLUENTD_SYSTEMD_CONF
            value: "disable"
        resources:
          limits:
            memory: 200Mi
          requests:
            cpu: 100m
            memory: 200Mi
        volumeMounts:
        - name: varlog
          mountPath: /var/log
        # When actual pod logs in /var/lib/docker/containers, the following lines should be used.
        - name: dockercontainerlogdirectory
          mountPath: /var/lib/docker/containers
          readOnly: true
      terminationGracePeriodSeconds: 30
      volumes:
      - name: varlog
        hostPath:
          path: /var/log
      # When actual pod logs in /var/lib/docker/containers, the following lines should be used.
      - name: dockercontainerlogdirectory
        hostPath:
          path: /var/lib/docker/containers
At line 68, I’ve put the elasticsearch service IP got from load balancer service.
At line 89-90, since systemd is not running in the container, we are disabling sytemd conf for fluentd
At line 97-112, I’ve changed the volume mounts so that fluentd collect the nodes and containers logs simultaneously
Finally, deploying the fluentd
kubectl create -f fluentd-ds-rbac.yaml
Wait for a few minutes to deploy. Finally you should see all the pods are deployed in the nodes in kube-system namespace.
$ kubectl -n kube-system get all -l=k8s-app=fluentd-logging

NAME                READY   STATUS    RESTARTS   AGE
pod/fluentd-hwzxv   1/1     Running   1          45m
pod/fluentd-m6fsm   1/1     Running   1          45m
pod/fluentd-mnsmk   1/1     Running   1          45m
pod/fluentd-t4m2z   1/1     Running   1          45m

NAME                     DESIRED   CURRENT   READY   UP-TO-DATE   AVAILABLE   NODE SELECTOR   AGE
daemonset.apps/fluentd   4         4         4       4            4           <none>          45m
Kibana
Lastly, we will deploy Kibana for data visualization. Again we will grab the values from here and modify according to our need. I’ve changed some values in values.yaml file and here is the final modification. Paste the following entries in kivalues.yaml file
---
elasticsearchHosts: "http://10.116.200.220:9200"

replicas: 1

image: "docker.elastic.co/kibana/kibana"
imageTag: "7.13.0"
imagePullPolicy: "IfNotPresent"

resources:
  requests:
    cpu: "1000m"
    memory: "1Gi"
  limits:
    cpu: "1000m"
    memory: "1Gi"

healthCheckPath: "/api/status"

httpPort: 5601

service:
  type: LoadBalancer #ClusterIP
  loadBalancerIP: ""
  port: 5601
  nodePort: ""
  labels: {}
  annotations: {}
    # cloud.google.com/load-balancer-type: "Internal"
    # service.beta.kubernetes.io/aws-load-balancer-internal: 0.0.0.0/0
    # service.beta.kubernetes.io/azure-load-balancer-internal: "true"
    # service.beta.kubernetes.io/openstack-internal-load-balancer: "true"
    # service.beta.kubernetes.io/cce-load-balancer-internal-vpc: "true"
  loadBalancerSourceRanges: []
    # 0.0.0.0/0
  httpPortName: http
At line 2, put the elasticsearch service IP.
At line 7, we explicitly define the image version to be 7.13.0 as our elasticsearch image have the same version. It is important to mention the version. Otherwise, version 8.0.0 will be deployed and EFK stack won’t work properly.
At line 13 & 16, I’ve set the memory 1 GB. If you have plenty of memory left in your nodes, the default value 2 GB is fine.
At line 18, health checker endpoint is changed to /api/status otherwise health checker might fail
Finaly at at line 23, service type changed to LoadBalancer so that we can access Kibana’s dashboard at port 5601
Install Kibana with Helm along with custom values
helm install kibana --version 7.13.0 elastic/kibana -f kivalues.yaml
After a few minutes, all the resources should be deployed and up and running.
$ kubectl get all -l=app=kibana

NAME                                 READY   STATUS    RESTARTS   AGE
pod/kibana-kibana-5ccc769fdc-fzmwz   1/1     Running   1          16h

NAME                    TYPE           CLUSTER-IP       EXTERNAL-IP      PORT(S)          AGE
service/kibana-kibana   LoadBalancer   10.105.148.183   10.116.200.221   5601:32548/TCP   16h

NAME                            READY   UP-TO-DATE   AVAILABLE   AGE
deployment.apps/kibana-kibana   1/1     1            1           16h

NAME                                       DESIRED   CURRENT   READY   AGE
replicaset.apps/kibana-kibana-5ccc769fdc   1         1         1       16h
Note down the external ip. In my case it is 10.116.200.221.
Now you should be able to visit Kibana’s dashboard at http://10.116.200.221:5601 😎
Setup index in Kibana for logs
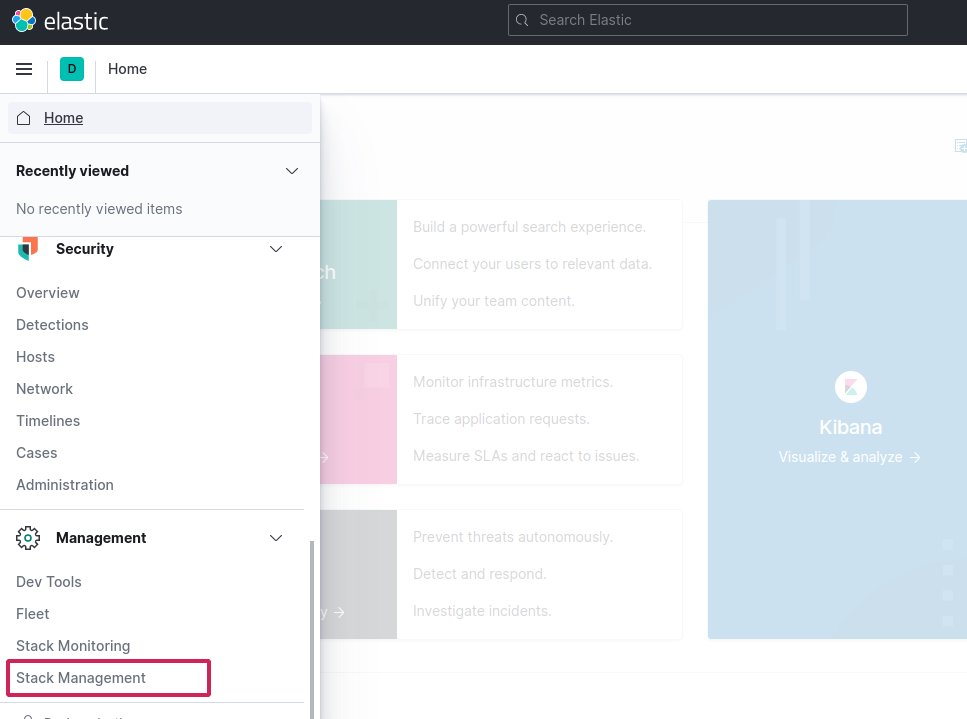
Go to stack management from left menu
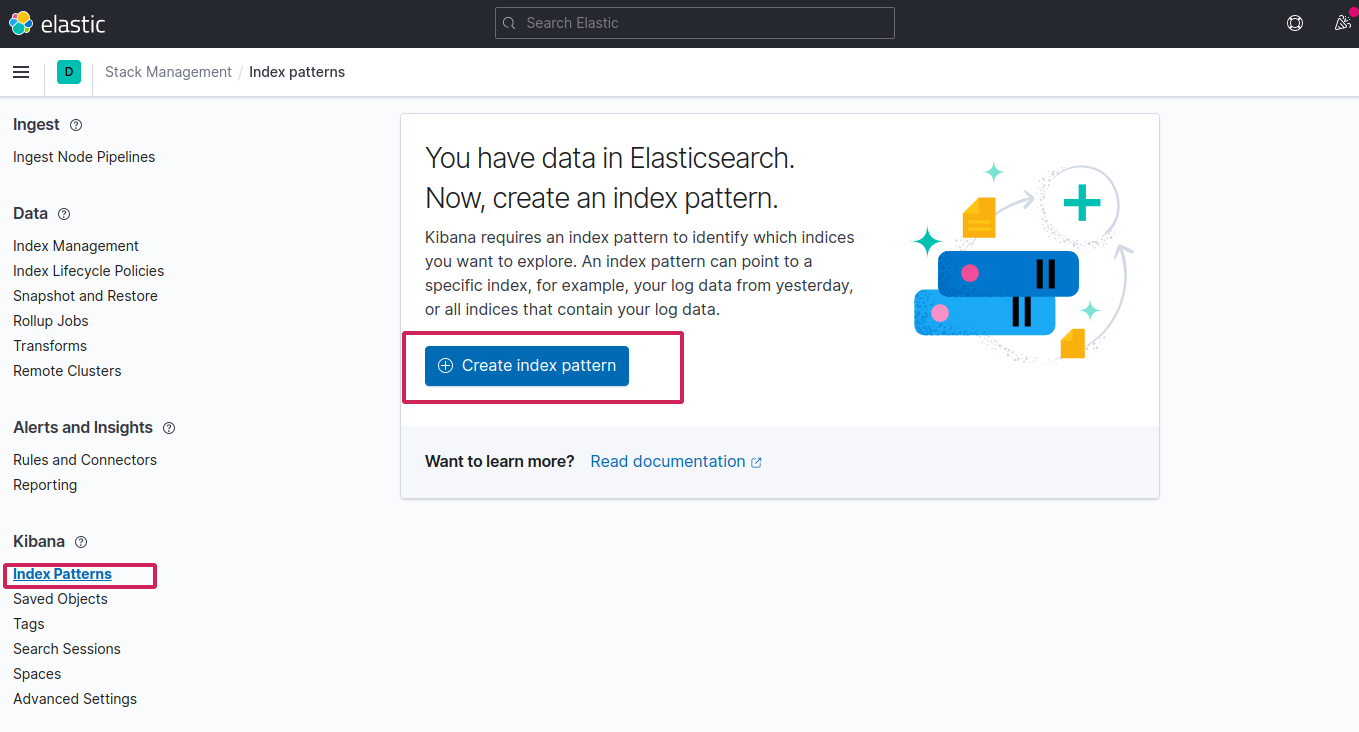
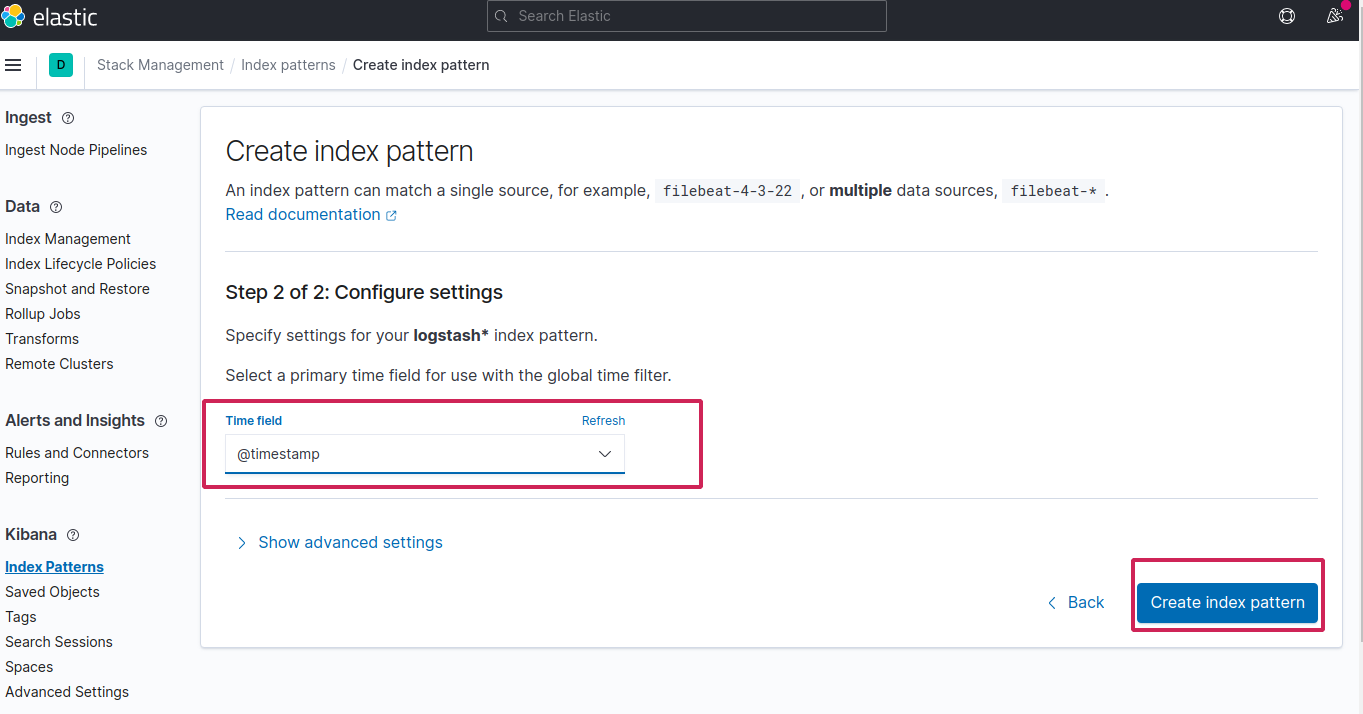
Select index patterns > Create new index pattern
Since fluentd followed the logstash format, create the index logstash-* to capture the logs coming from cluster
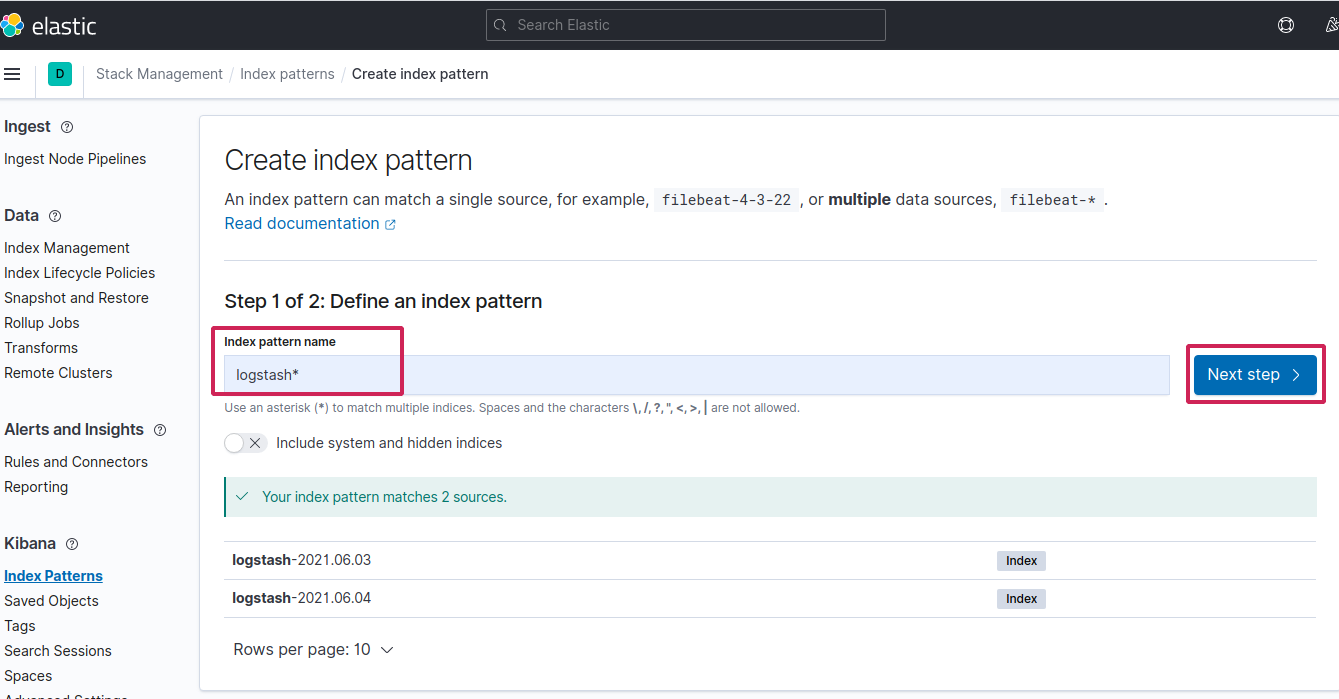 Finally put
 @timestamp in time field and create the index pattern
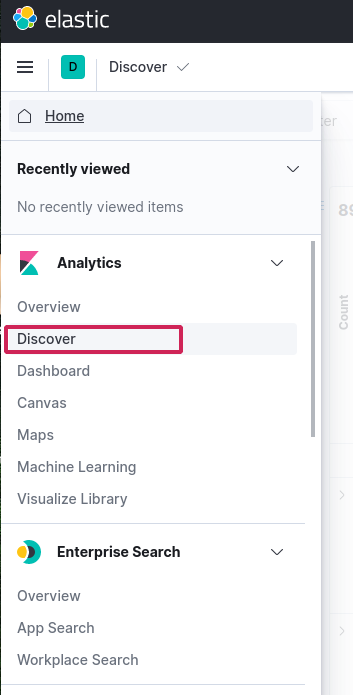
Now go to Discover from left, you should see the logs
Testing the setup
Let’s test the stack by deploying a simple hellopod which just counts.
cat <<EOF | kubectl apply -f -
apiVersion: v1
kind: Pod
metadata:
 name: hellopod
spec:
 containers:
 - name: count
   image: busybox
   args: [/bin/sh, -c,
           'i=0; while true; do echo "$i: Hello from the inside"; i=$((i+1)); sleep 1; done']
EOF
See the logs
$kubectl logs hellopod -f

0: Hello from the inside
1: Hello from the inside
2: Hello from the inside
3: Hello from the inside
4: Hello from the inside
5: Hello from the inside
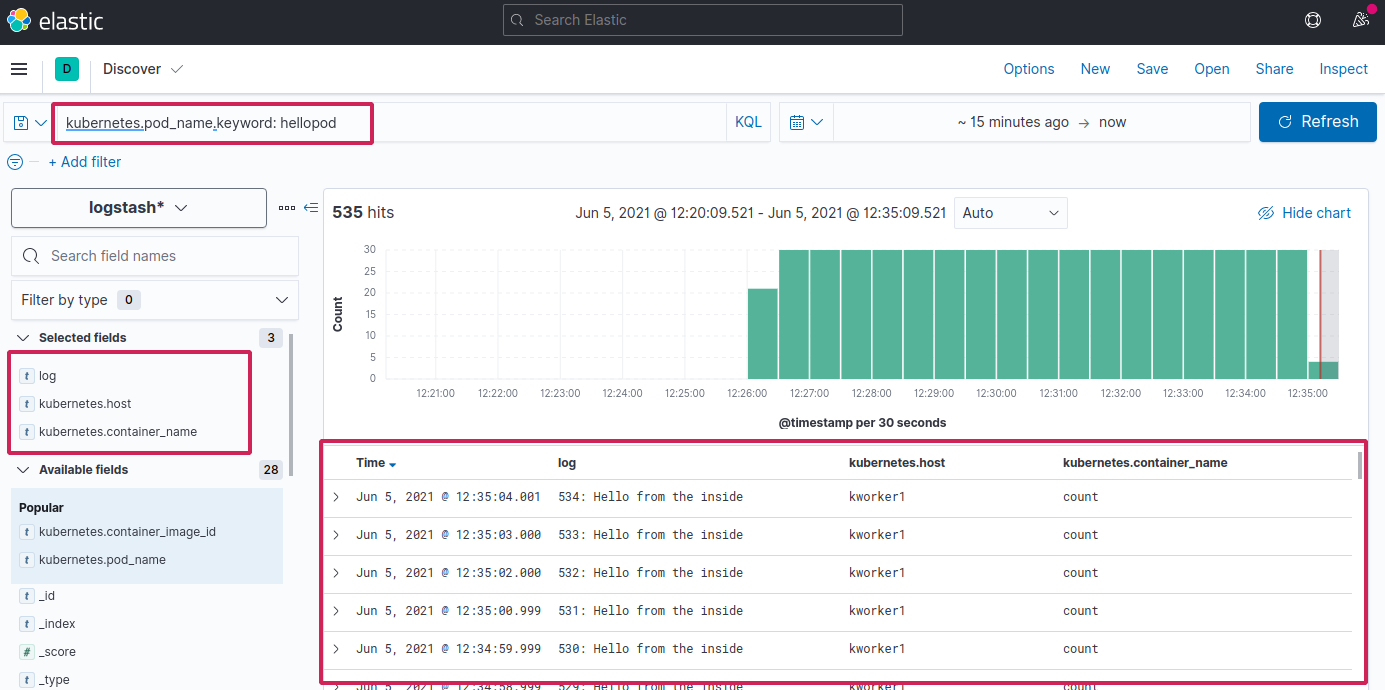
Now in Kibana, if you search for kubernetes.pod_name.keyword: hellopod and filter with log and other fields from left, you should see the same logs in Kibana dashboard along with other informations. How cool is that 😃
Success (phew!). We have just setup EFK stack in Kubernetes 😎