Elastic stack (ELK) is a combination of multiple open source products (Elastic search+Logstash+Kibana) which takes data from different sources and visualize the data in Kibana.
In this tutorial, we will see how to setup Elastic stack with Metricbeat by using docker 🤓. Metricbeat is a data shipper which collect the metrics from the system’s logs and services. We will setup Metricbeat in a way so that it collects the system’s metric and then ship the data to the Elastic stack. Elasticsearch will make the index out of it and transfer the index data to Kibana to visualize the data.
We will use two servers (A & B) for this tutorial. Elastic stack will be installed in Server A. Metricbeat will be installed in Server B. Metricbeat will collect the system metrics (cpu, memory, file system etc) from Server B and ship those data to the Server A running ELK stack for visualizing the data.
We will not use Logstash in this tutorial as we don’t need much filtering/processing of the metrics data.
Setting up docker and installing Elastic stack (ELK)
There are several ways of installing ELK stack. However, my favorite way of installing it by using Docker. Installing ELK stack with docker takes less than a minute to initialize!
First thing first, we will install docker along with docker-compose in Server A & B. As I already setup docker with docker-compose in those servers, now I will setup ELK stack in Server A.
- Clone the docker-elk repository (unofficial) from GitHub.
- Make sure you fulfill the requirements
- Now let’s disable the paid features first as we don’t need it for this tutorial
cd docker-elk/
vi elasticsearch/config/elasticsearch.yml
Set xpack.license.self_generated.type from trial to basic. Save and exit
- If you want to change the default authentication of the stack, you can change it by following the instructions given in the repo. However I will use the default one (username: elastic, password: changeme).
4a. (optional). Now edit the docker-compose.yml file inside the docker-elk folder. We will comment out the logstash service as we won’t use it. So the final compose file will look like this:
version: '3.2'

services:
  elasticsearch:
    build:
      context: elasticsearch/
      args:
        ELK_VERSION: $ELK_VERSION
    volumes:
      - type: bind
        source: ./elasticsearch/config/elasticsearch.yml
        target: /usr/share/elasticsearch/config/elasticsearch.yml
        read_only: true
      - type: volume
        source: elasticsearch
        target: /usr/share/elasticsearch/data
    ports:
      - "9200:9200"
      - "9300:9300"
    environment:
      ES_JAVA_OPTS: "-Xmx256m -Xms256m"
      ELASTIC_PASSWORD: changeme
      # Use single node discovery in order to disable production mode and avoid bootstrap checks
      # see https://www.elastic.co/guide/en/elasticsearch/reference/current/bootstrap-checks.html
      discovery.type: single-node
    networks:
      - elk

#  logstash:
#    build:
#      context: logstash/
#      args:
#        ELK_VERSION: $ELK_VERSION
#    volumes:
#      - type: bind
#        source: ./logstash/config/logstash.yml
#        target: /usr/share/logstash/config/logstash.yml
#        read_only: true
#      - type: bind
#        source: ./logstash/pipeline
#        target: /usr/share/logstash/pipeline
#        read_only: true
#    ports:
#      - "5000:5000/tcp"
#      - "5000:5000/udp"
#      - "9600:9600"
#    environment:
#      LS_JAVA_OPTS: "-Xmx256m -Xms256m"
#    networks:
#      - elk
#    depends_on:
#      - elasticsearch

  kibana:
    build:
      context: kibana/
      args:
        ELK_VERSION: $ELK_VERSION
    volumes:
      - type: bind
        source: ./kibana/config/kibana.yml
        target: /usr/share/kibana/config/kibana.yml
        read_only: true
    ports:
      - "5601:5601"
    networks:
      - elk
    depends_on:
      - elasticsearch

networks:
  elk:
    driver: bridge

volumes:
  elasticsearch:
- Cool! Now we are ready to fire up the compose file. Just run the below command (while inside in the docker-elk folder)
docker-compose up -d
The stack services will run in the background (-d, detach mode). Let’s see whether the services are running or not:
docker-compose ps

Up and running. Checking out the logs file:
docker-compose logs -f
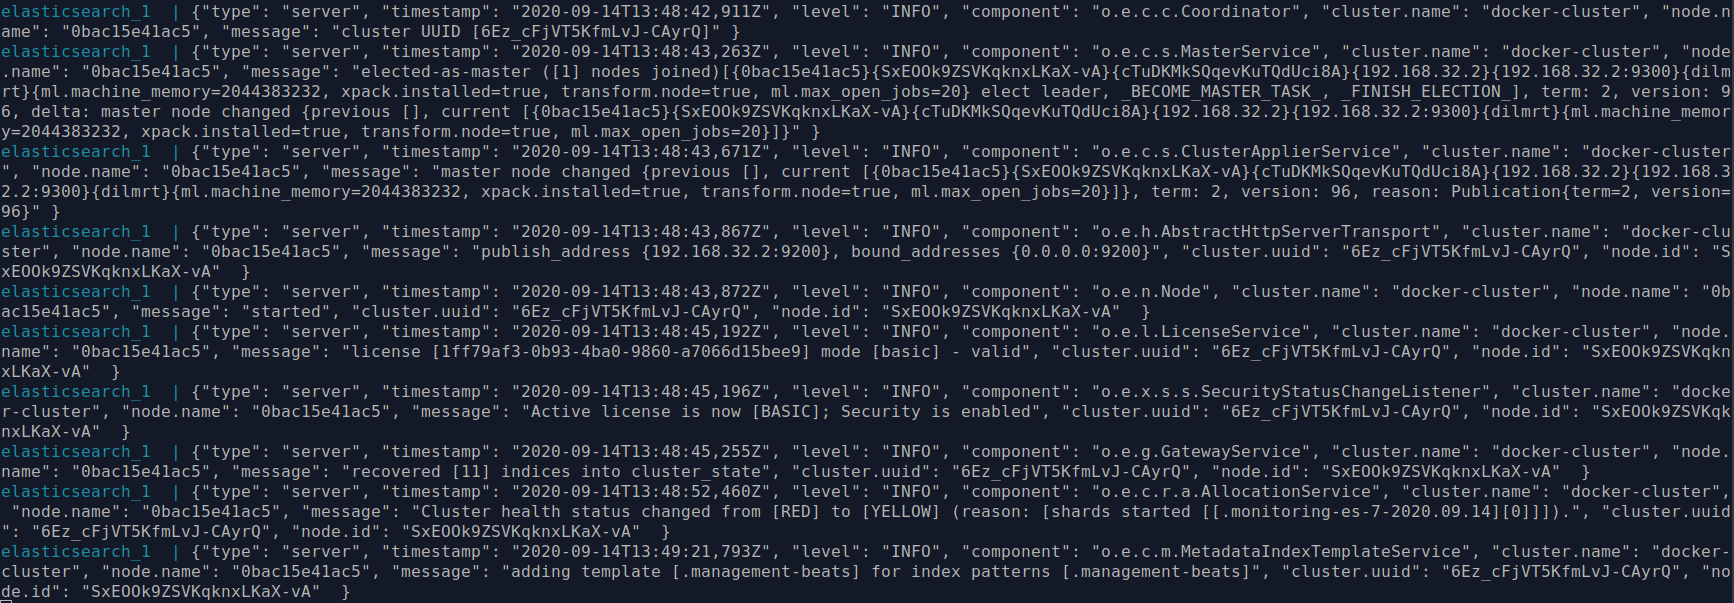
Looks good also! We just setup ELK stack in Server A. Let’s configure Metricbeat in server B.
Setting up Metricbeat in server for collecting logs
Now we will setup the Metricbeat in Server B in order to collect the server metrics. Again, we will use docker container for get the job done! To do that, I will use official Metricbeat tutorial for docker.
- First, run the following command in Server B. Don’t forget to put the ServerA’s IP address in ELK-IP-Address in the command and put username and password if you change the default one. We will send Metricbeat’s data to ServerA which is running the ELK stack, remember? 😉
Note: It’s not ideal to send secure data (username/password) in plain text. You might wanna secure it. Please refer to this guide on how to securely communicate with elasticsearch.
docker run \
docker.elastic.co/beats/metricbeat:7.9.1 \
setup -E setup.kibana.host=ELK-IP-Address:5601 \
-E output.elasticsearch.hosts=["ELK-IP-Address:9200"] \
-E output.elasticsearch.username=elastic \
-E output.elasticsearch.password=changeme
Now we need to instruct the Metricbeat to collect the data from the host machine. You may already know that the container running inside docker do not have any connection with the host machine. The container that runs inside the docker works in full isolation mode. However, the Metricbeat container needs to collect the host’s log file in order to collect the host’s metrics. Thus we need to bind the host’s log files into the Metricbeat so that it have access the host’s log files.
To make the process easier, I’ve prepared the compose file which will get the job done for you 😎 All you need to do is to change the ELK-IP-Address, username and password of the ELK stack (if you change the default one). Also, change the hostname according to your host machine.
- Copy the codes from below and create a file metricbeat.yml. Paste the code
version: "3.2"

services:
  metricbeat:
    container_name: metricbeat
    hostname: "metricbeat-MyServerB"
    user: root
    image: docker.elastic.co/beats/metricbeat:7.9.1
    volumes:
      - /proc:/hostfs/proc:ro
      - /sys/fs/cgroup:/hostfs/sys/fs/cgroup:ro
      - /:/hostfs:ro
    network_mode: "host"
    command: metricbeat -e -system.hostfs=/hostfs -E output.elasticsearch.hosts=ELK-IP-Address:9200 -E output.elasticsearch.username=elastic -E output.elasticsearch.password=changeme
    restart: on-failure
- Run the compose file and see it’s logs:
docker-compose up -f metricbeat.yml -d
docker-compose logs -f metricbeat.yml -f
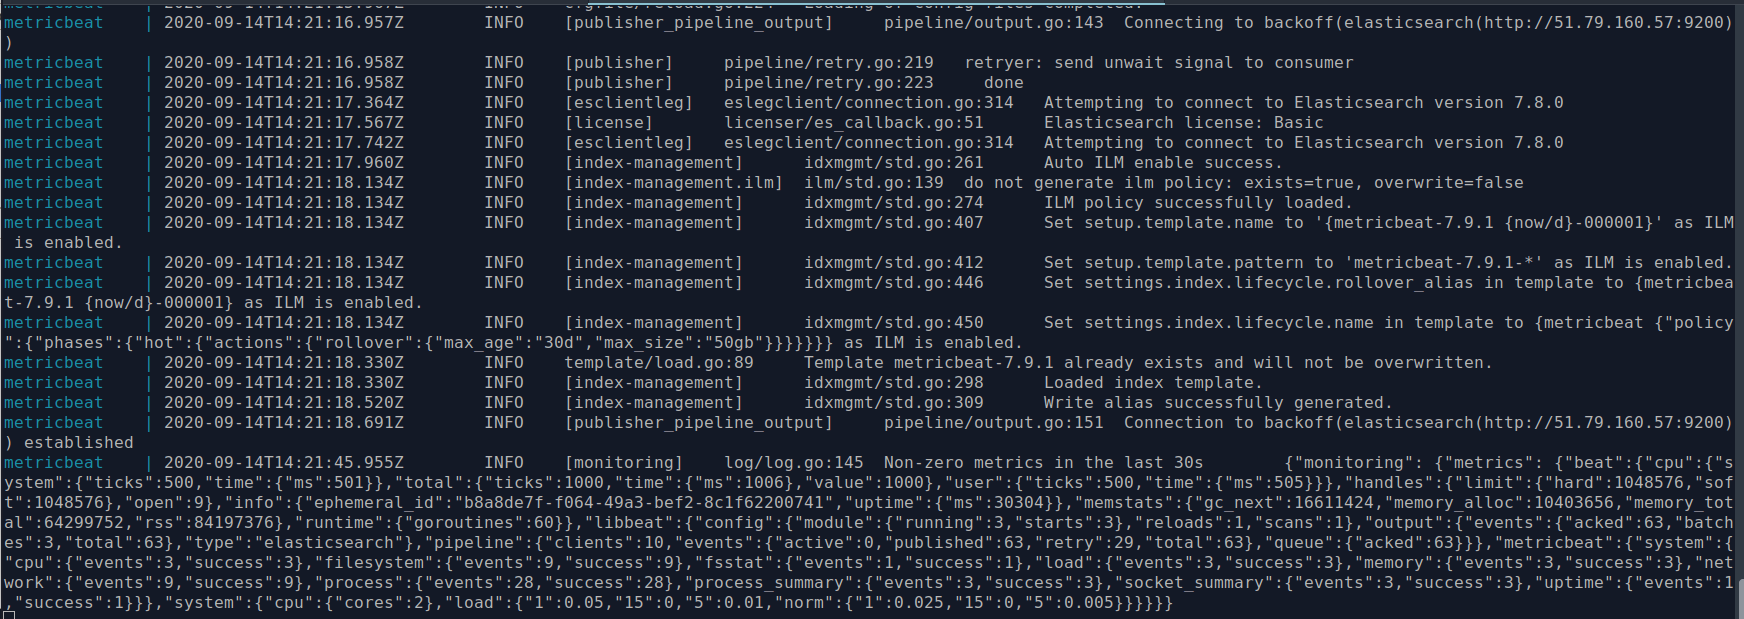
Looks like Metricbeats is working fine. It looks like gibberish like before but for our ELK stack, it’s not!
Checking Metricbeat’s data in Kibana
Our setup part is done! We set up ELK stack in server A and Metricbeat in server B for collecting the metric data from server B. Now let’s visit the Kibana dashboard to visualize the metric data of Server B.
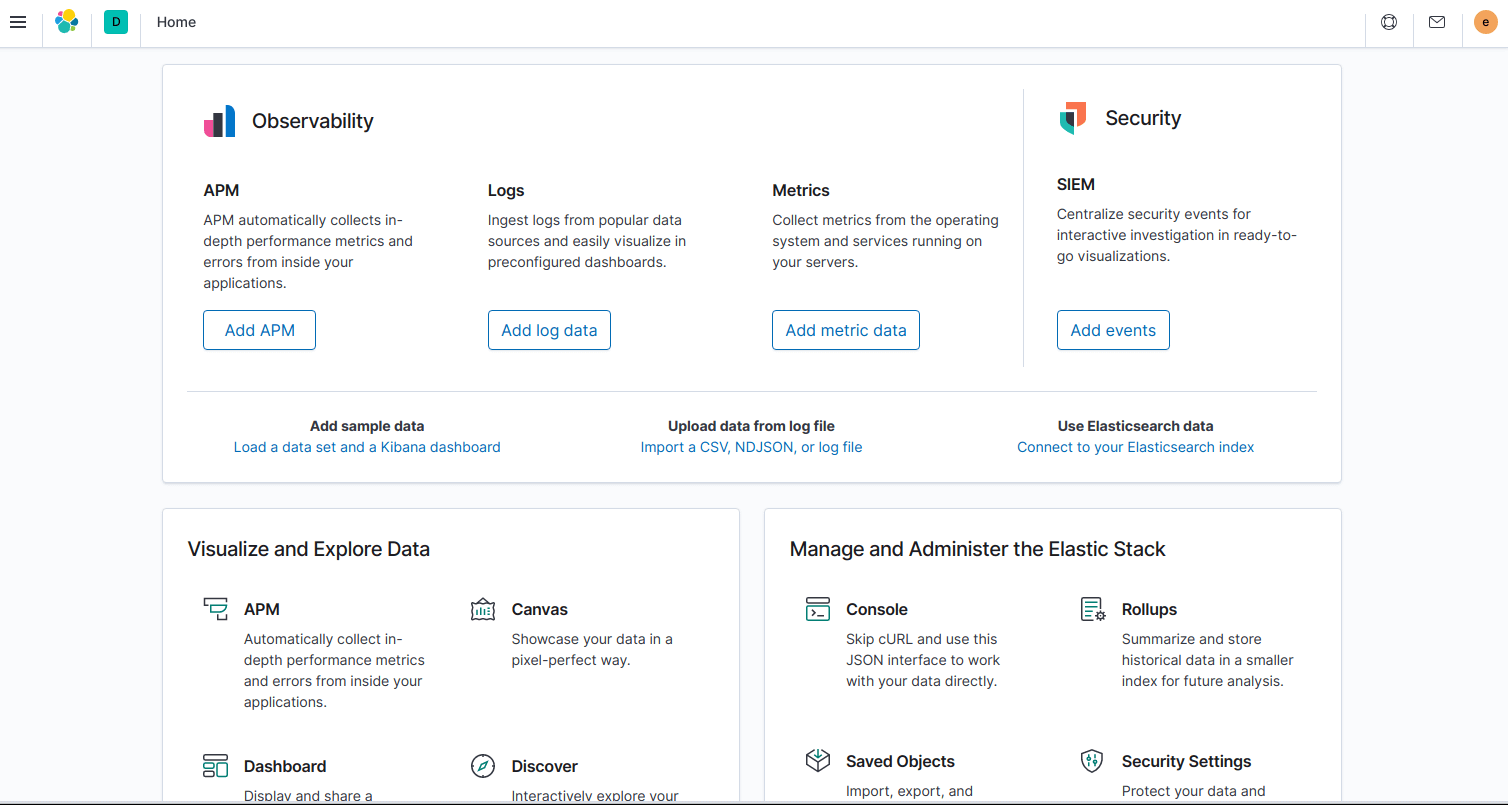
- Visit ELK server’s (Server A) IP address with port 5601. Exm: http://1.2.3.4:5601/ Login with the username and password. You should see a window like this:
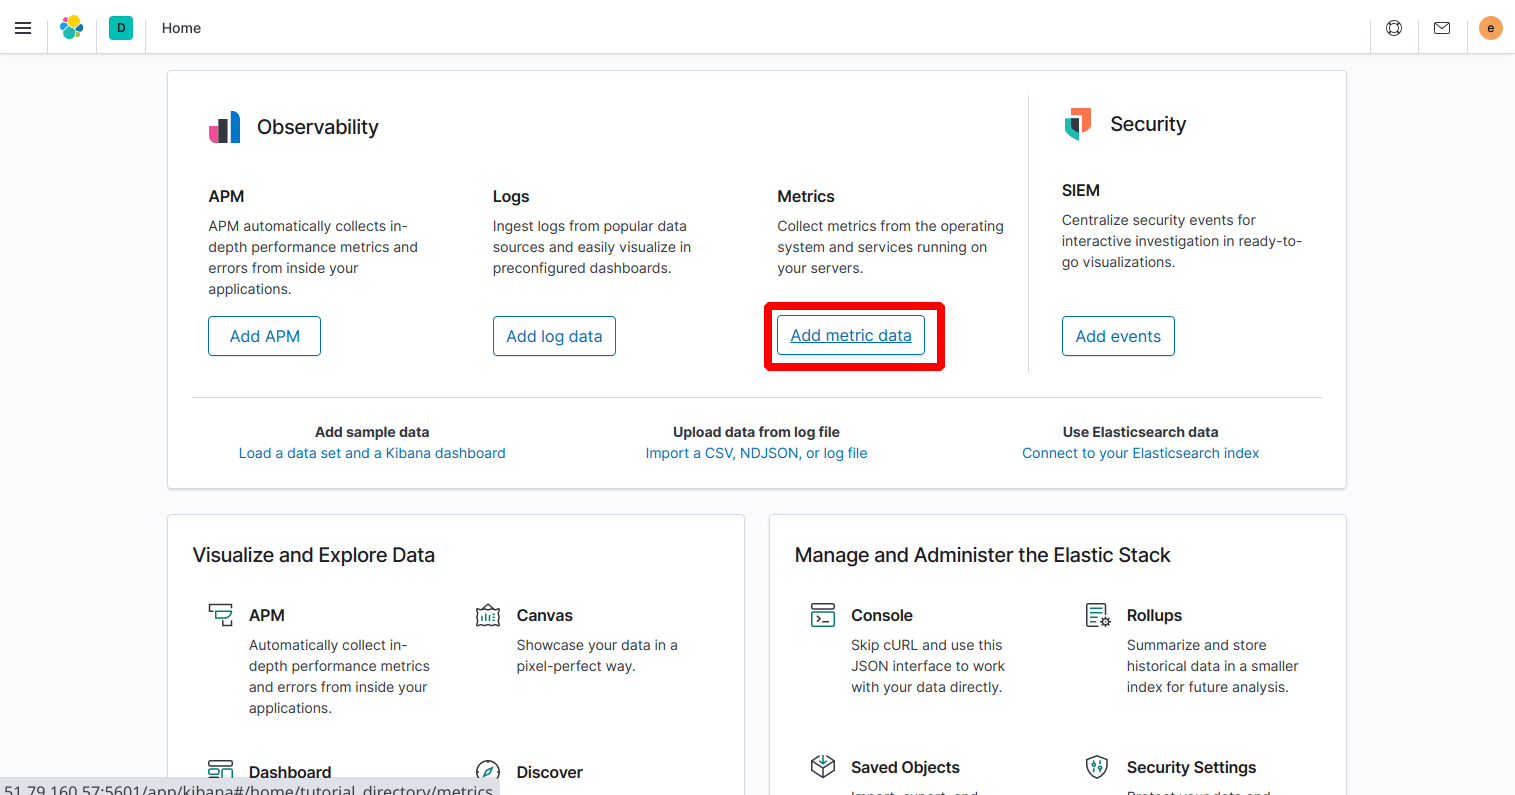
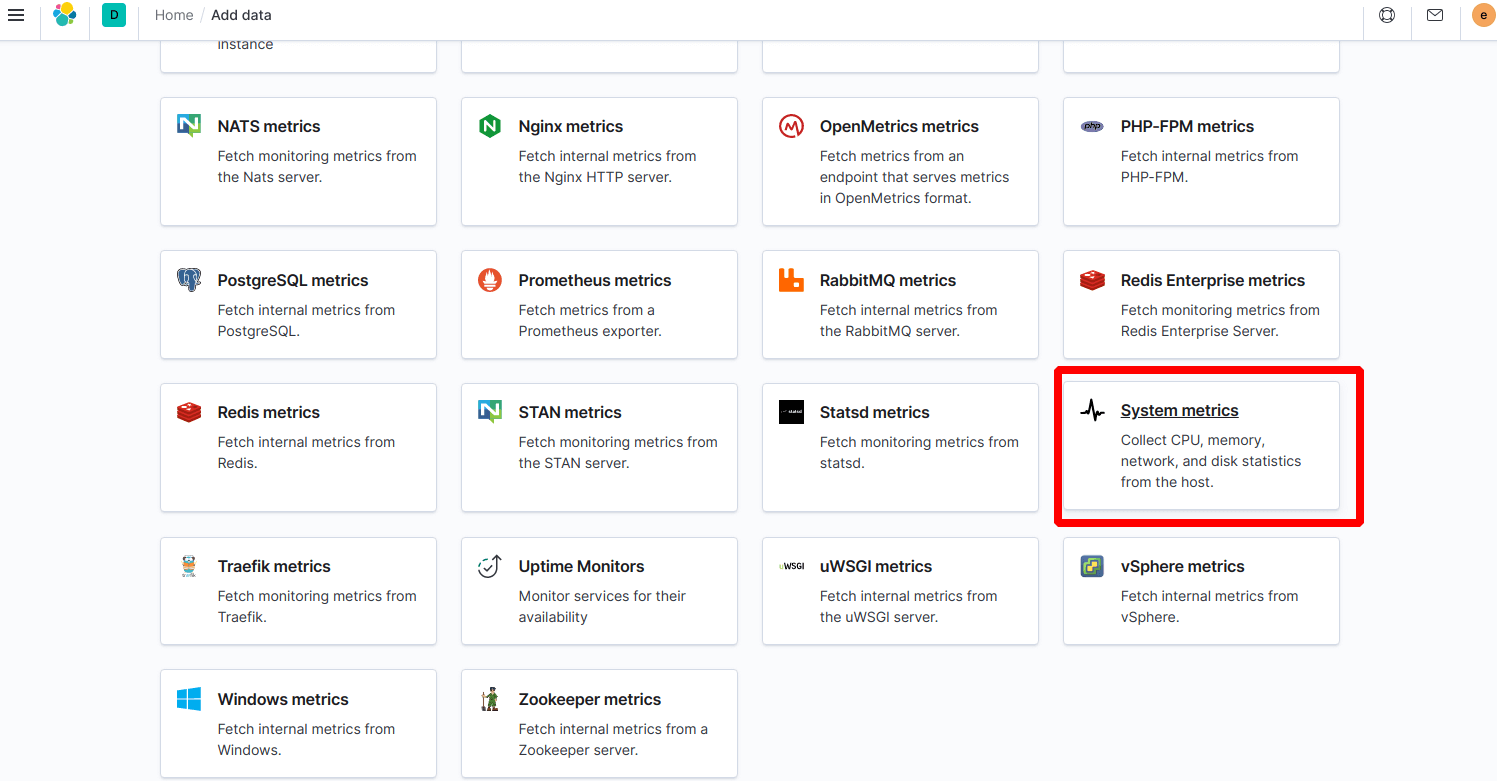
- Click “Add metric data”
- Select “System metrics” from below
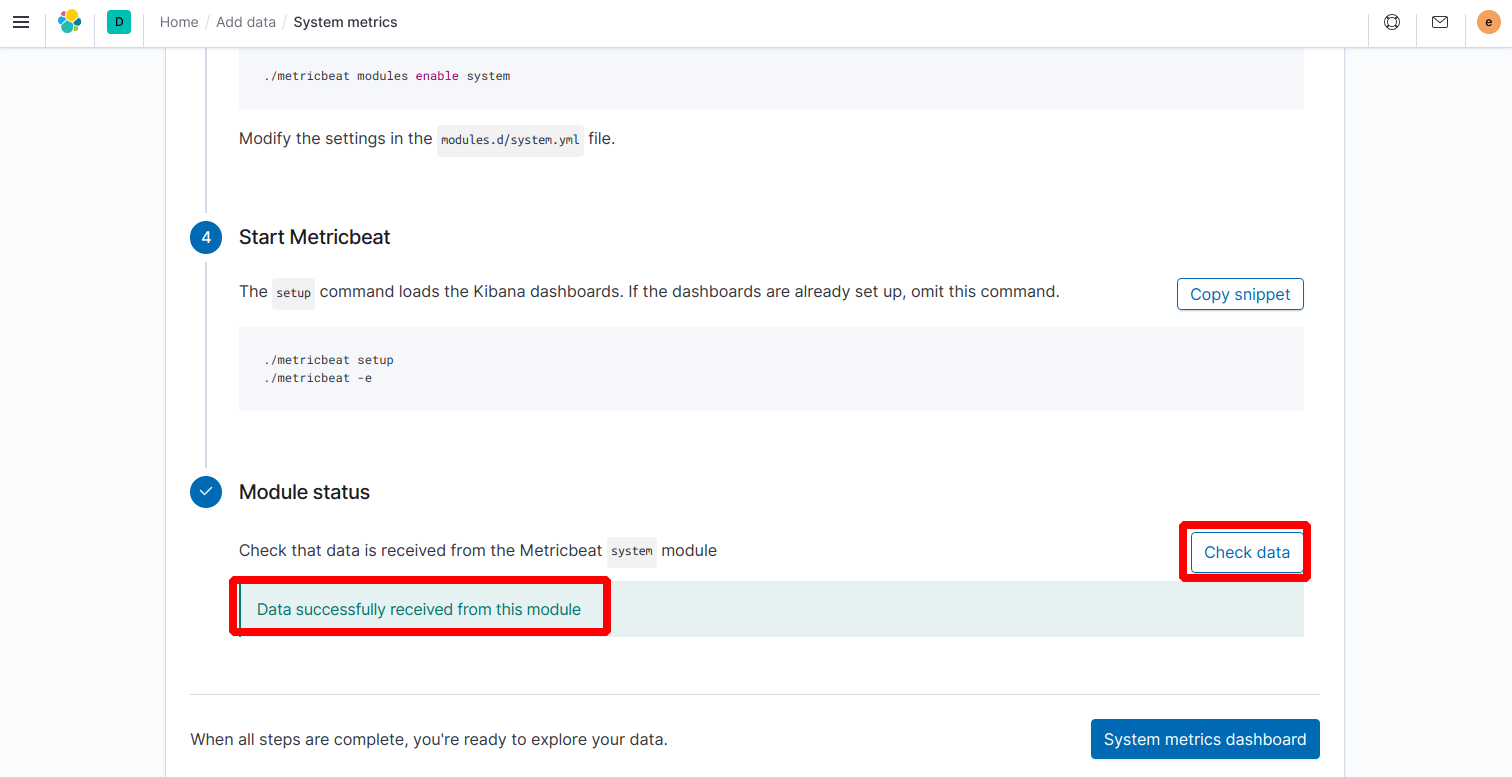
- Click “Check data”. If everything goes well, you should see a message that data successfully received.
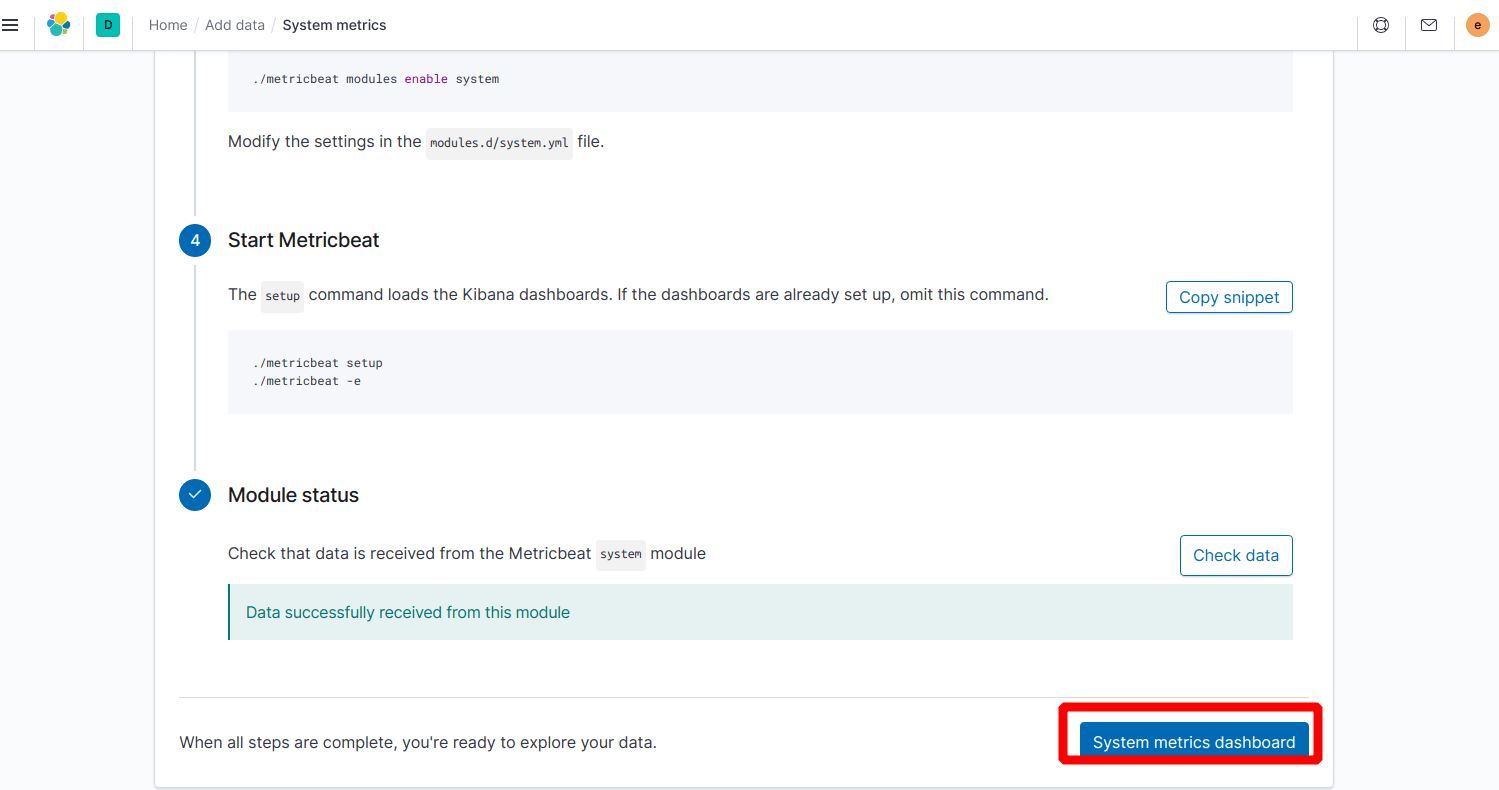
- Click “System metrics dashboard”
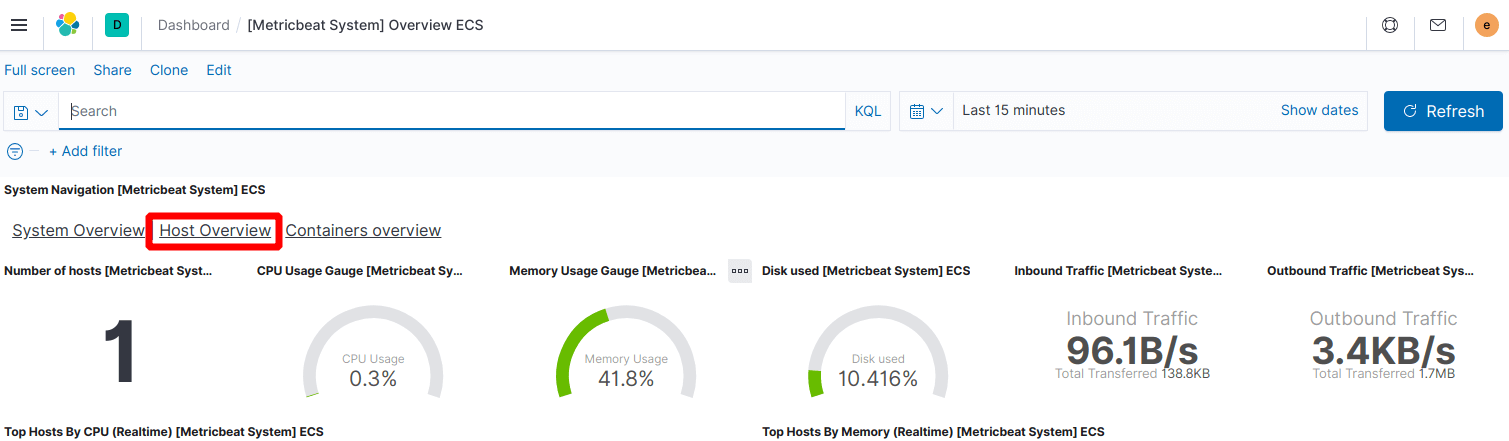
- We will see the system overview page. Currently we are monitoring one host (Server B)
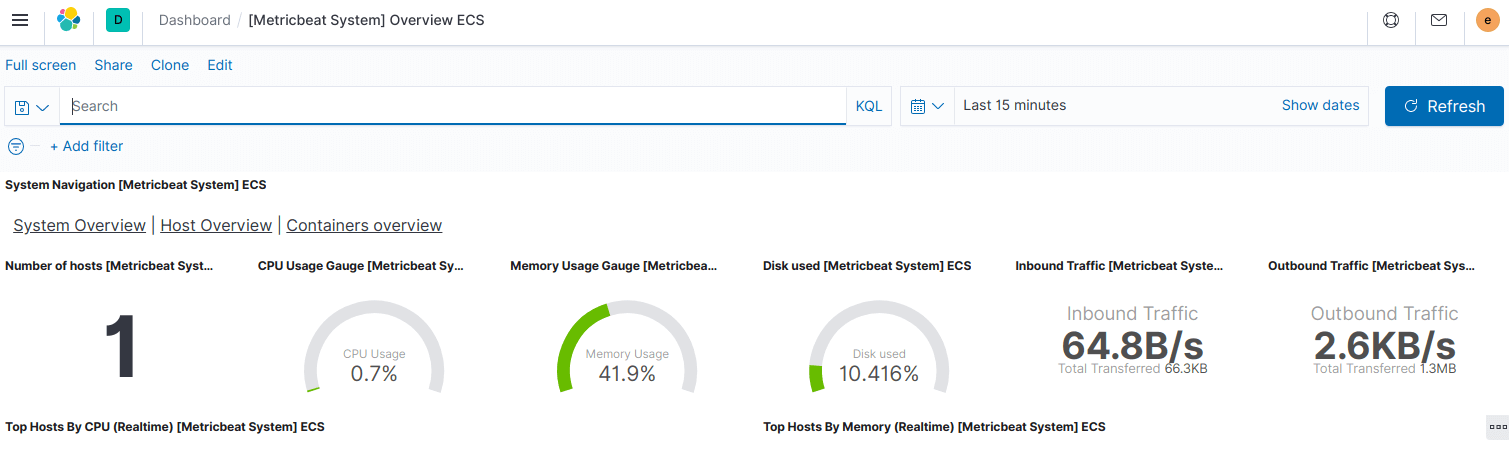
- Click one “Host overview” for more in depth details about the running host
- In “Host overview” page, search your hostname like below screenshot and click update. You should see the metrics of your remote server in a few seconds.
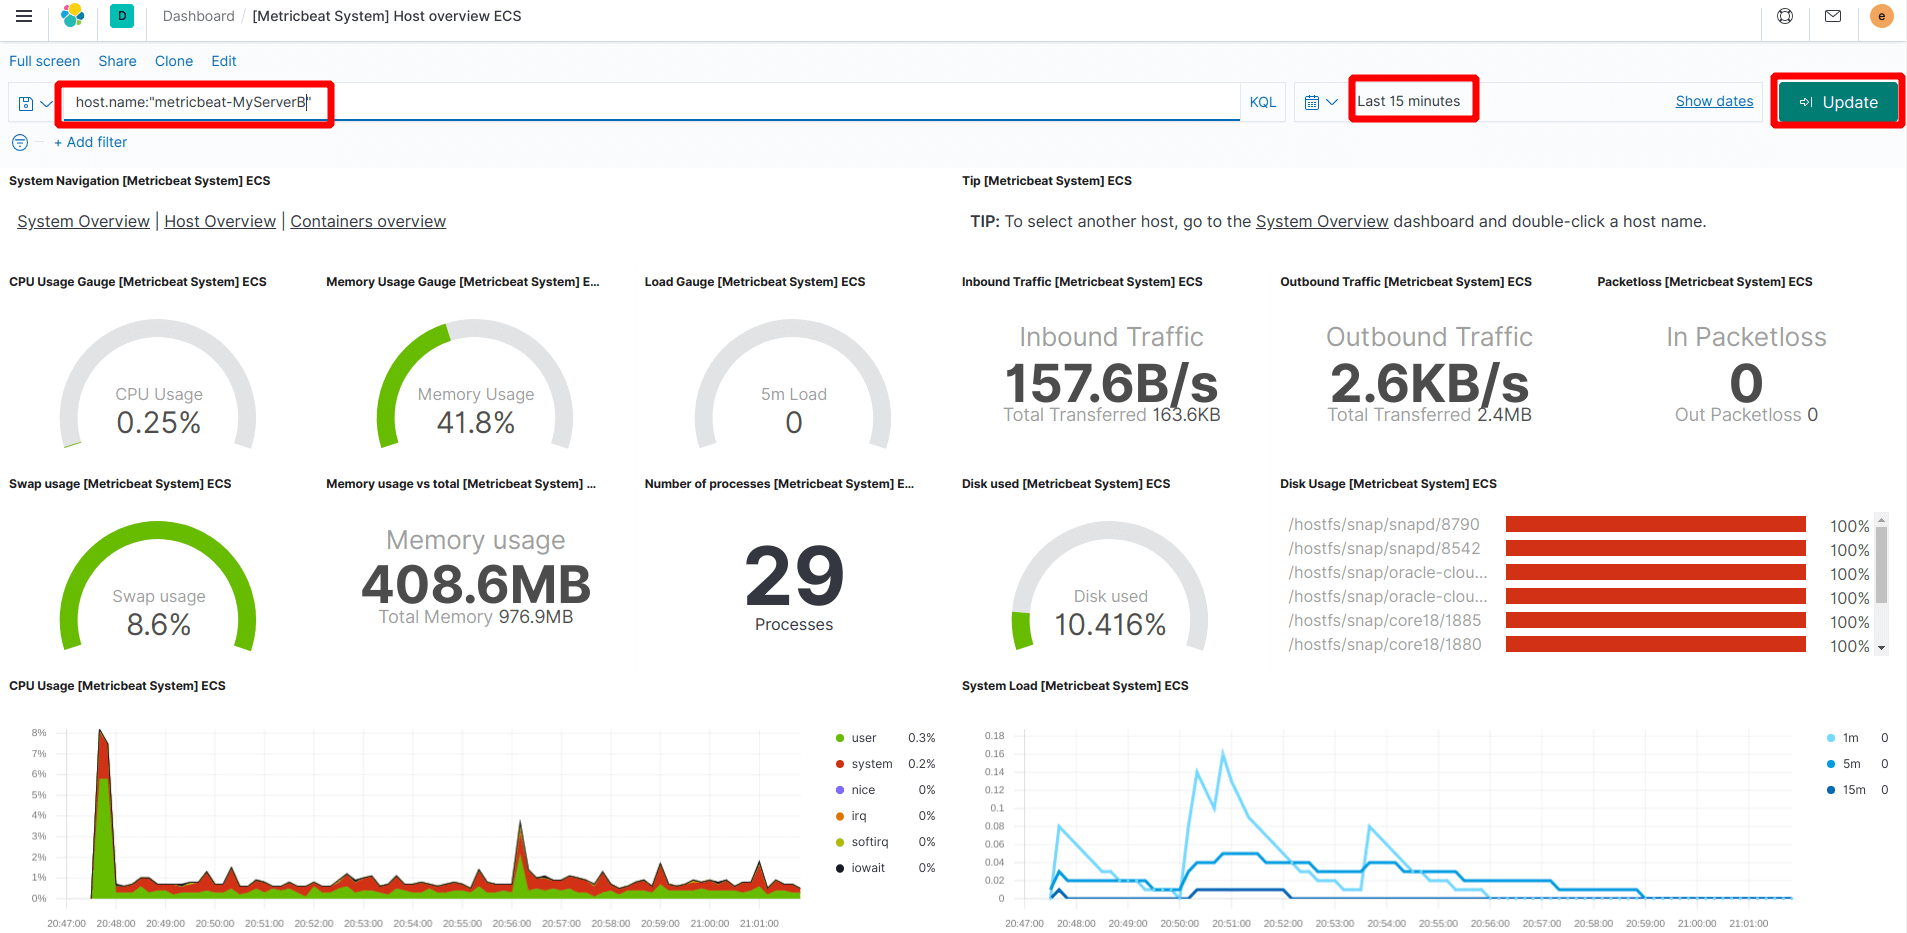
Success! 😊 You have successfully setup ELK stack (without Logstash) with Metricbeat. Now Metricbeat is running on Server B for collecting and shipping the server’s metric data to the ELK stack. We are seeing the data in Kibana’s beautiful dashboard.