Kubernetes is a very dynamic environment. In order to monitor this, we need a tool like Prometheus which can monitor such dynamic environment. In this tutorial, we will setup Prometheus which will collect the data from Kubernetes cluster and visualize it in Grafana. We will use Helm chart to setup Prometheus and Grafana easily 😎
Prerequisite
- A dynamic persistent provisioner. You can check my other guide on Setting up dynamic NFS provisioning in Kubernetes with Helm 3.
Setting default storage class
- First, let’s check the status of the storage class in our cluster. We deployed this storage class while we setup dynamic NFS provisioning.
$kubectl get storageclass

NAME                 PROVISIONER                            RECLAIMPOLICY   VOLUMEBINDINGMODE      ALLOWVOLUMEEXPANSION   AGE
nfs-client           cluster.local/nfs-client-provisioner   Delete          Immediate              true                   76m
standard (default)   rancher.io/local-path                  Delete          WaitForFirstConsumer   false                  103m
Our storage class name is “nfs-client” which is currently not default. We need to make this storage class default so that Prometheus and Grafana use that storage class without explicitly defining it in their configuration files.
- Disabling default storage class for “standard” and making “nfs-client” as default
kubectl patch storageclass standard -p '{"metadata": {"annotations":{"storageclass.kubernetes.io/is-default-class":"false"}}}'

kubectl patch storageclass nfs-client -p '{"metadata": {"annotations":{"storageclass.kubernetes.io/is-default-class":"true"}}}'
- Check the default storage class
$ kubectl get storageclass

NAME                   PROVISIONER                            RECLAIMPOLICY   VOLUMEBINDINGMODE      ALLOWVOLUMEEXPANSION   AGE
nfs-client (default)   cluster.local/nfs-client-provisioner   Delete          Immediate              true                   83m
standard               rancher.io/local-path                  Delete          WaitForFirstConsumer   false                  110m
Default storage class is now set to nfs-client. Cool.
Setting up Prometheus
- Next, we will setup Prometheus using Helm chart. Make sure that Helm version is 3
$ helm version --short

v3.2.4+g0ad800e
- Adding Prometheus to Helm repo and update
$ helm repo add prometheus-community https://prometheus-community.github.io/helm-charts
$ helm repo update
- We will save the Helm values of Prometheus in current directory. We need to change some settings before deploying the Helm chart in the cluster.
$ helm inspect values prometheus-community/prometheus > ./prometheus.values
- The above command will download the values required for deploying Prometheus and save in
prometheus.valuesfile in current directory. Open theprometheus.valuesand modify the service block like below
service:
  annotations: {}
  labels: {}
  clusterIP: ""

  ## List of IP addresses at which the Prometheus server service is available
  ## Ref: https://kubernetes.io/docs/user-guide/services/#external-ips
  ##
  externalIPs: []

  loadBalancerIP: ""
  loadBalancerSourceRanges: []
  servicePort: 80
  sessionAffinity: None
  nodePort: 32322     #This line is added
  type: NodePort      #Changed ClusterIP to NodePort
In above service block, we changed the service type to NodePort so that we can access Prometheus externally. We also define nodePort to 32322. Save and exit the file.
- Provisioning Prometheus with custom values
$ helm install prometheus prometheus-community/prometheus --values ./prometheus.values --namespace prometheus --create-namespace
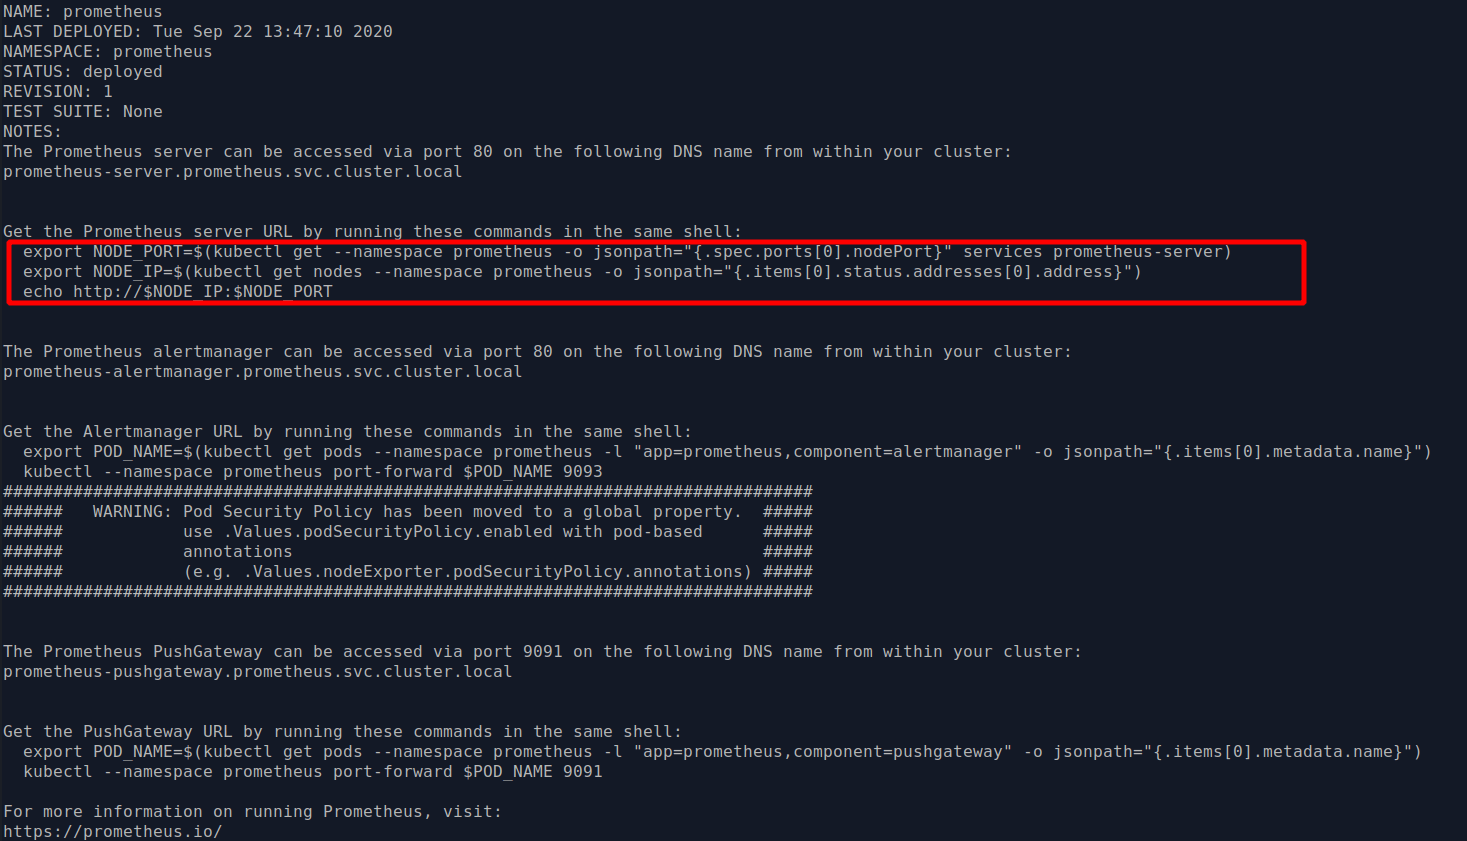
- Run the following command to get the IP address and port as described in the picture to access Prometheus server. In my case it is http://172.20.0.2:32322
$ export NODE_PORT=$(kubectl get --namespace prometheus -o jsonpath="{.spec.ports[0].nodePort}" services prometheus-server)
$ export NODE_IP=$(kubectl get nodes --namespace prometheus -o jsonpath="{.items[0].status.addresses[0].address}")
$ echo http://$NODE_IP:$NODE_PORT
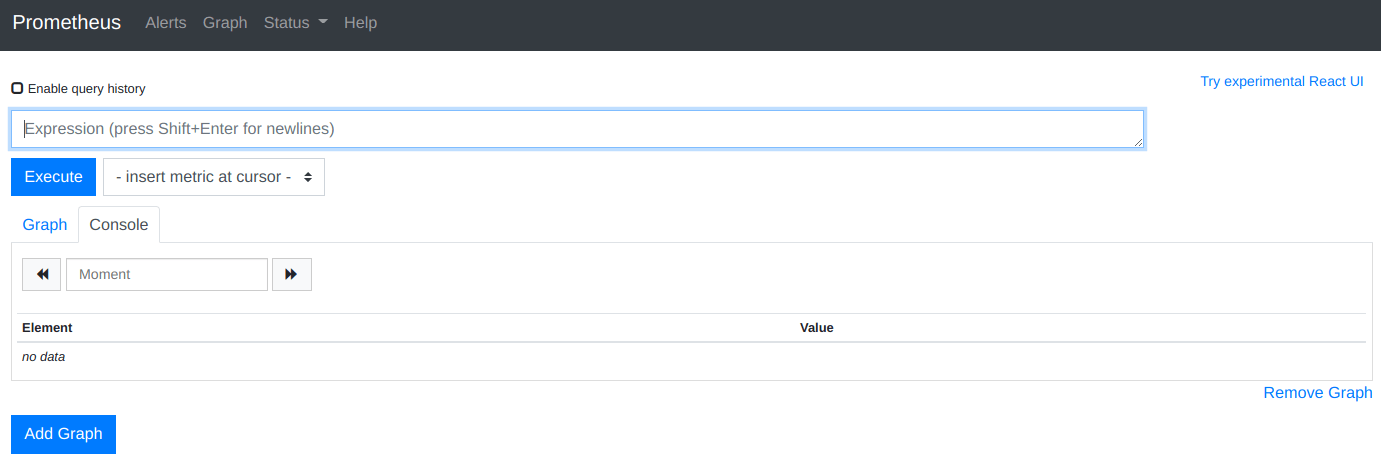
- Visit the URL with port. You should see a page like this
Note: If you can’t access the server, you might need to add a custom route. Run the below command (ONLY if you can’t access the server). Replace the IP address according to your Prometheus URL. Also change the network (-net) address. After that, you should see above page.
sudo route add -net 172.20.0.0 netmask 255.255.255.0 gw 172.20.0.2
Setting up Grafana
Now we will setup Grafana to visualize the data from Prometheus which are now currently collecting the data from Kubernetes cluster.
- Adding the Grafana to the Helm repo and update
$ helm repo add grafana https://grafana.github.io/helm-charts
$ helm repo update
- Like Prometheus, we will save the Helm values of Grafana in current directory.
$ helm inspect values grafana/grafana > ./grafana.values
- Open the
grafana.values. We need to modify in fields
i) Find the service block and modify like below
## Expose the grafana service to be accessed from outside the cluster (LoadBalancer service).
## or access it from within the cluster (ClusterIP service). Set the service type and the port to serve it.
## ref: http://kubernetes.io/docs/user-guide/services/
##

service:
  type: NodePort       # Change from ClusterIP to NodePort
  nodePort: 32323      # This line is added. Defined nodePort to 32323
  port: 80
    # targetPort: 4181 To be used with a proxy extraContainer
  annotations: {}
  labels: {}
  portName: service
ii) Setting the admin user and password
# Administrator credentials when not using an existing secret (see below)
adminUser: admin
adminPassword: averystrongpassword
ii) Enabling PVC
## Enable persistence using Persistent Volume Claims
## ref: http://kubernetes.io/docs/user-guide/persistent-volumes/
##
persistence:
  type: pvc
  enabled: enabled   (Changed false to enabled)
Save and exit.
- Install Grafana with custom values
$ helm install grafana grafana/grafana --values ./grafana.values --namespace grafana --create-namespace
- You should see the output like below. Similarly, in order to get the IP and port for accessing Grafana dashbord, run the following commands
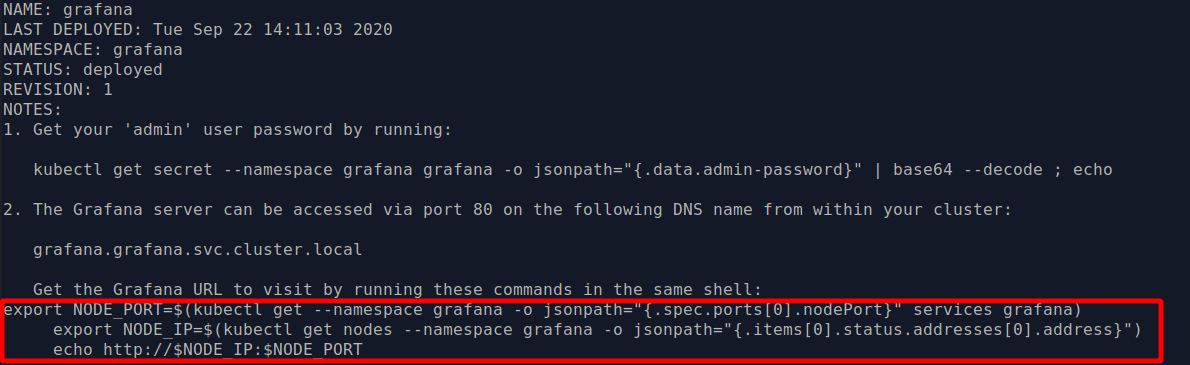
$ export NODE_PORT=$(kubectl get --namespace grafana -o jsonpath="{.spec.ports[0].nodePort}" services grafana)
$ export NODE_IP=$(kubectl get nodes --namespace grafana -o jsonpath="{.items[0].status.addresses[0].address}")
$ echo http://$NODE_IP:$NODE_PORT
In my case, the IP and port is http://172.20.0.2:32323. Visit the URL and you should see the Grafana dashboard. Login with your admin username and password.
Configure Grafana for collecting data from Prometheus
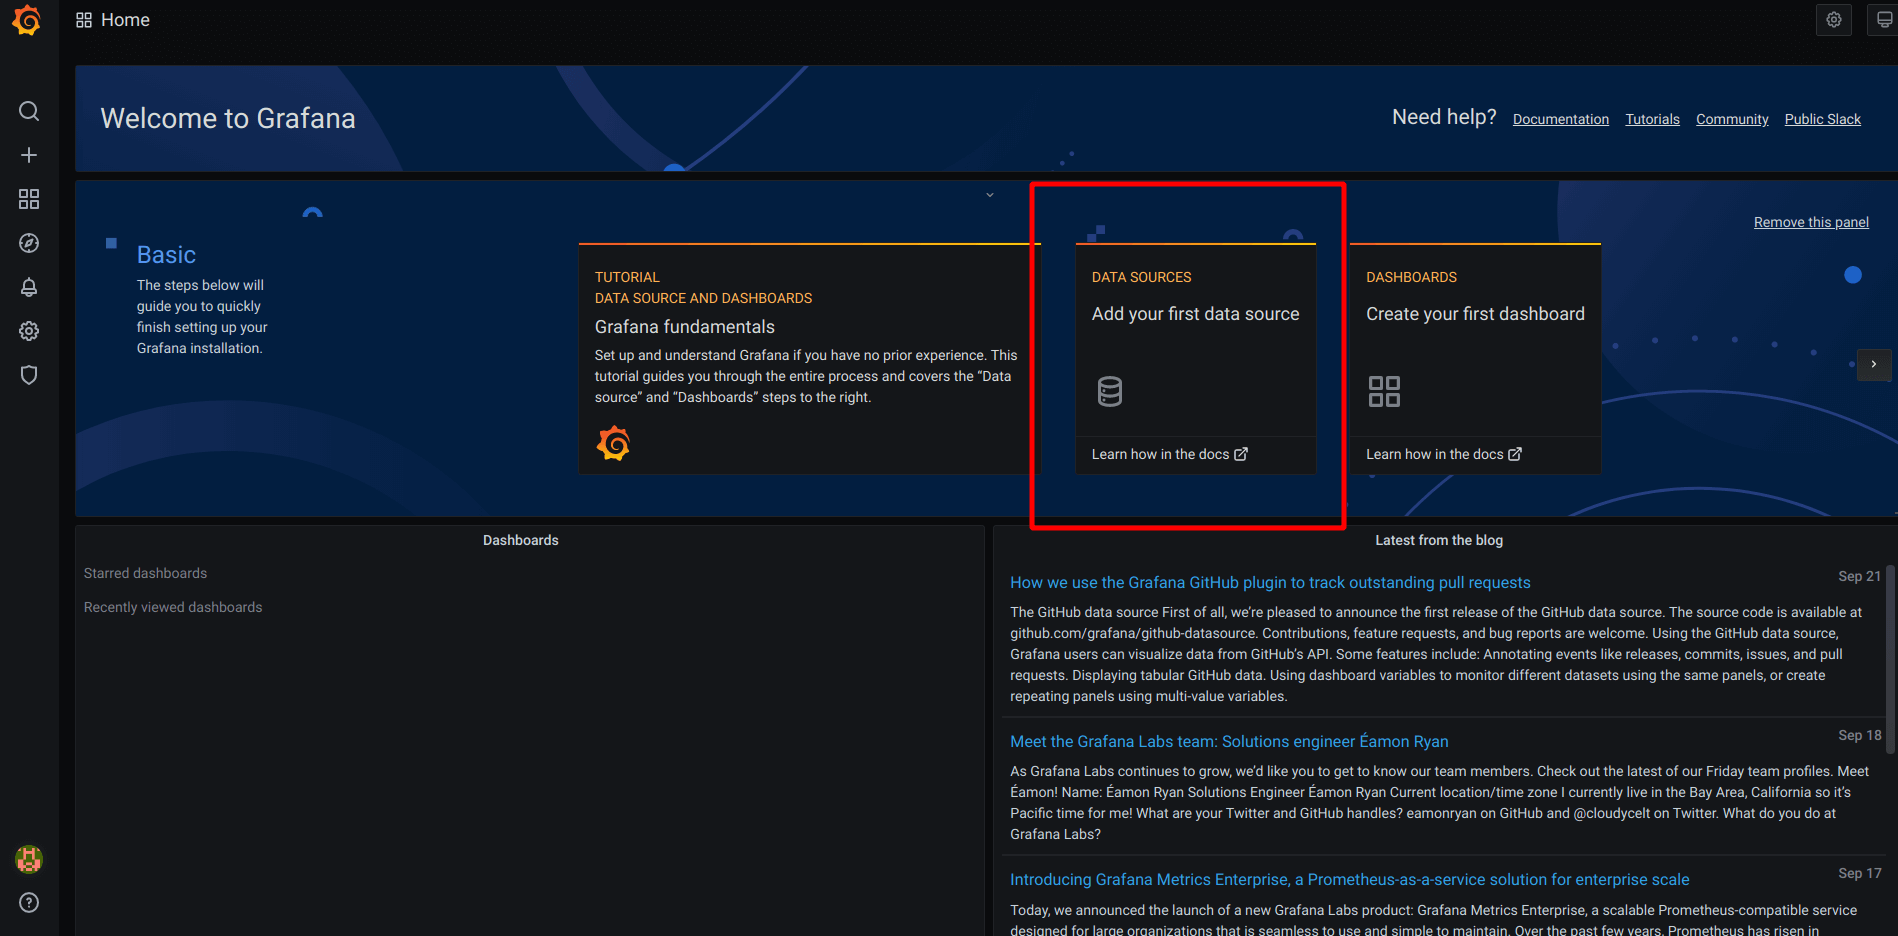
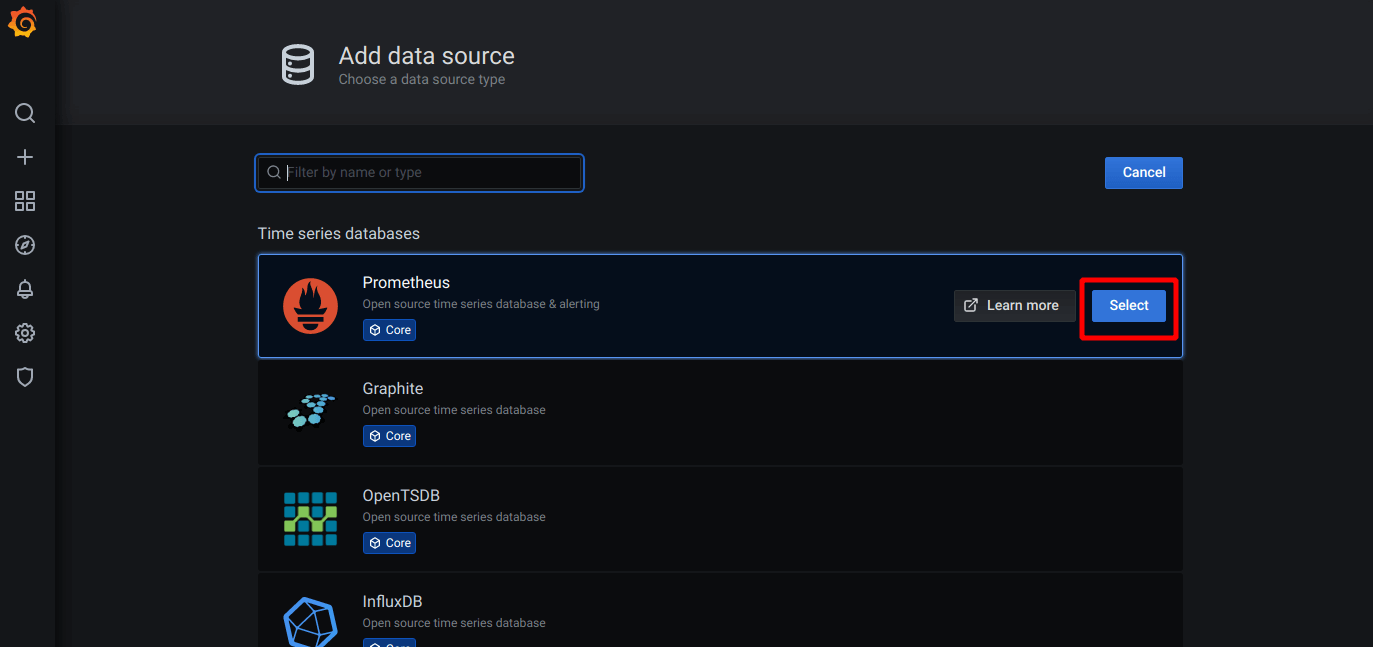
- Our setup part is done. Now we will configure Grafana for collecting the data from Prometheus. Click “Add your first data source” and select “Prometheus”
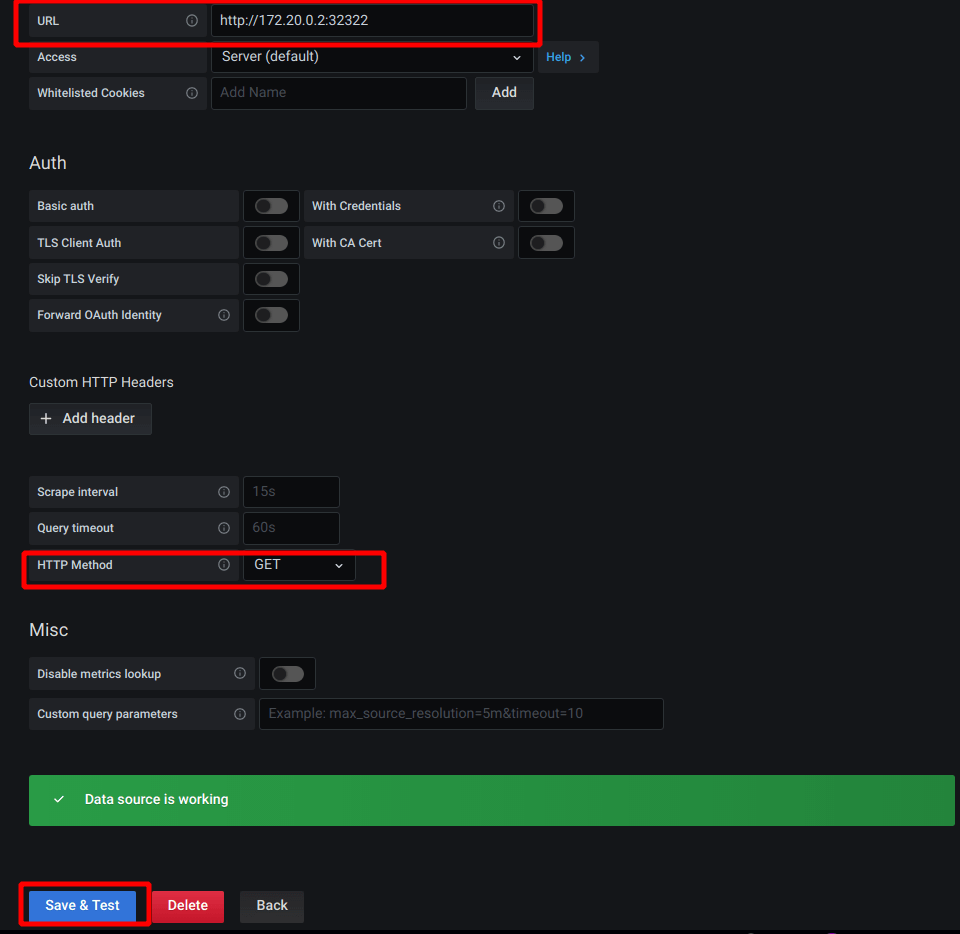
- Set “URL” to the Prometheus server URL. Also set HTTP method to “GET”. When done, “Save & Test”. You should see “Data source is working” message.
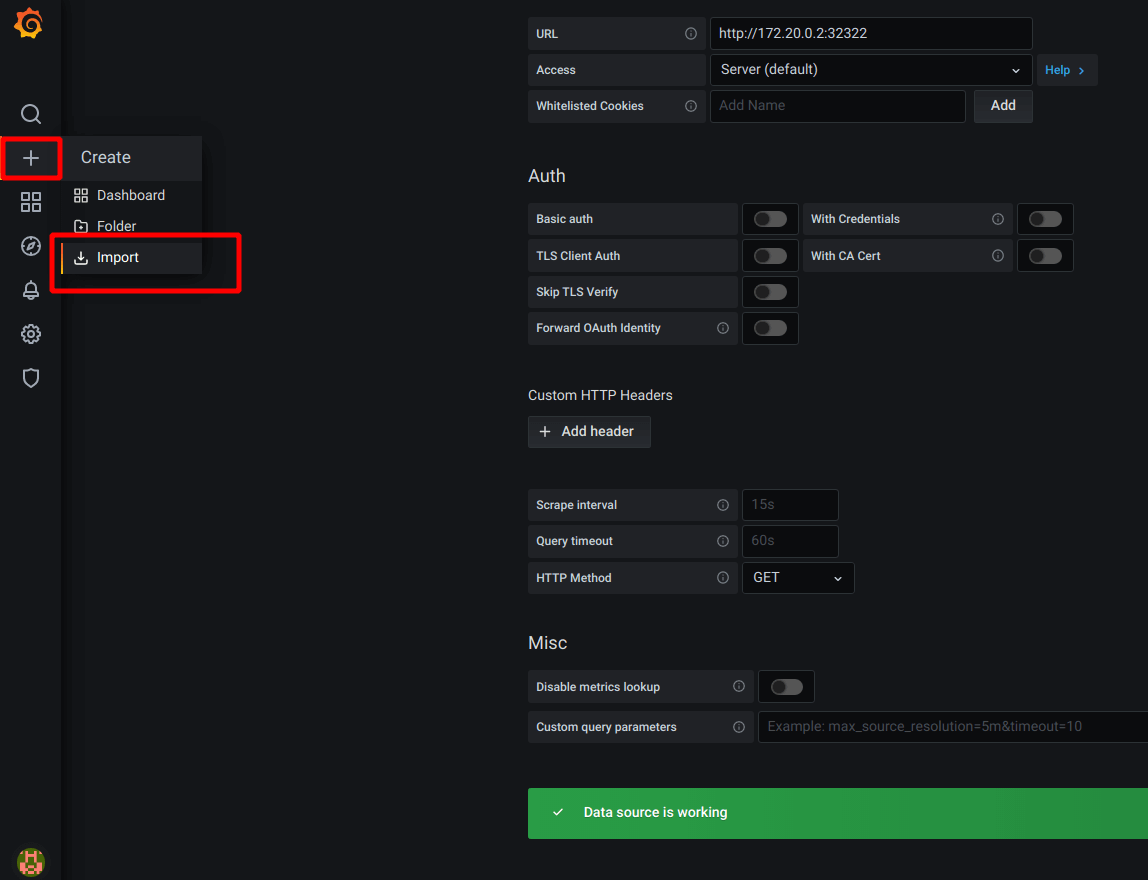
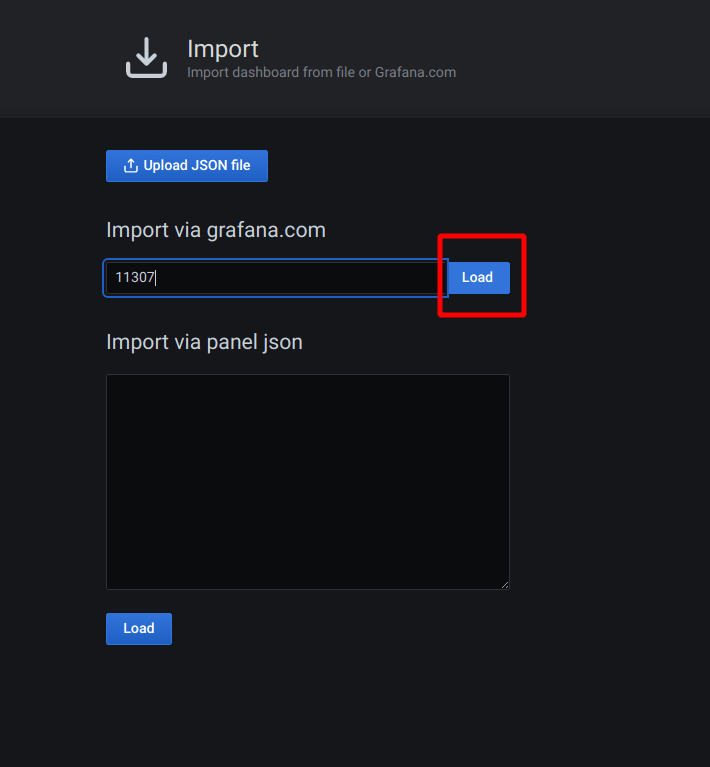
- Now we will import a dashboard to visualize the collected data. From left menu, click import
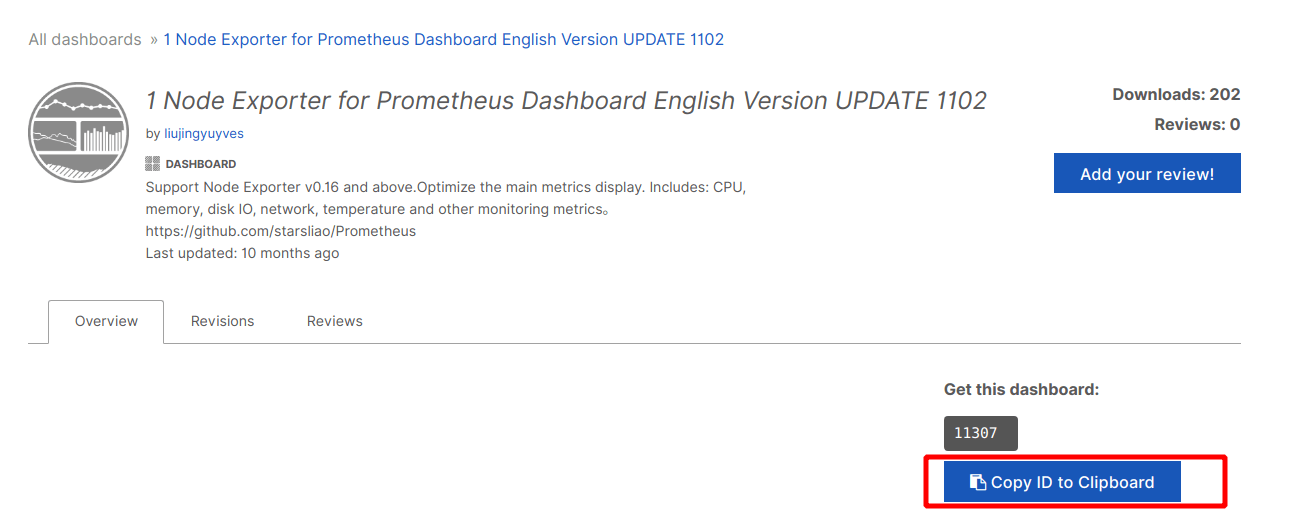
- You can visit grafana’s community built dashboard. Select any of the dashboard and copy it’s id. Paste it to the import page and click “Load”
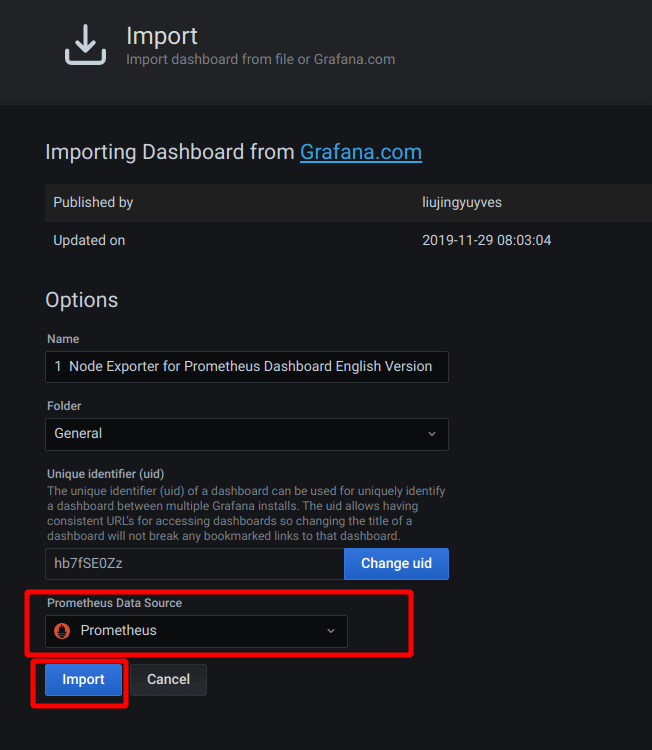
- Select “Prometheus” as data source and click “Import”
A nice beautiful dashboard will be presented to you which will show the current cluster’s info
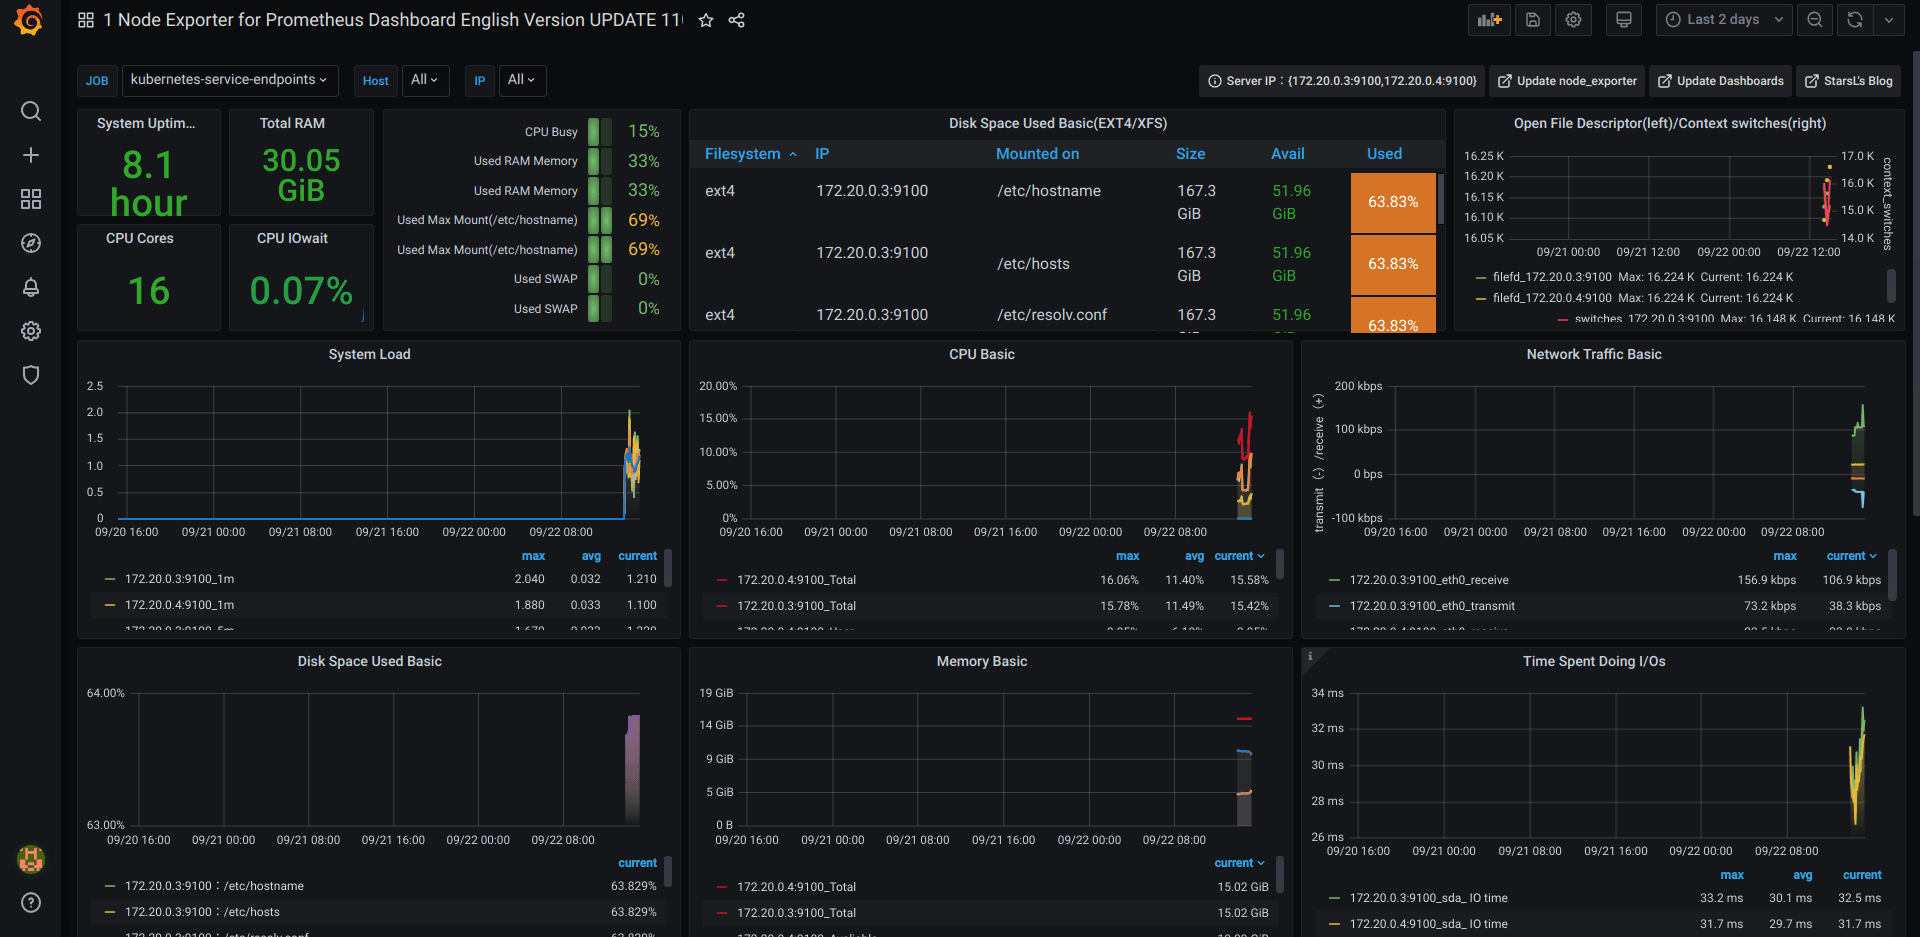
We just successfully setup Prometheus and Grafana to monitor and visualize our Kubernetes cluster.