If you are running PHP-FPM applications in Kubernetes, you have likely hit by the following warning:
WARNING: [pool www] server reached pm.max_children setting, consider raising it.
When this happens, applications load very slowly. So what you need to do is configure the pm.max_children accordingly. We can adjust the FPM configuration and add more pods horizontally in order to deal with the max_children issue.
Prerequisite:#
Make sure you have the Prometheus/VictoriaMetrics stack with Grafana installed. For this tutorial, I will be using VictoriaMetrics (deployed in monitoring namespace), a lightweight Prometheus alternative.
Configuring PHP-FPM#
First, we need to configure PHP-FPM to static and the pm.max_children value should be low as each pod shouldn’t run too many processes. Also, we need to enable the status page in order to let the exporter scrape the PHP-FPM metrics from the status page (more on this later). So here is a sample configuration:
pm = static
pm.status_path = /status
pm.max_children = 10
; A child process will handle at least 200 requests before respawning.
pm.max_requests = 200
Setup php-fpm exporter#
In order to scrape php-fpm metrics from application, we will deploy hipages/php-fpm_exporter exporter as sidecar. Exporter will read metrics from the /status page and export those metrics for Prometheus/VictoriaMetrics. Later, we will grab those exported values with VictoriaMetrics.
 1
 2
 3
 4
 5
 6
 7
 8
 9
10
11
12
13
14
15
16
17
18
19
20
21
22
23
24
25
26
27
28
29
30
31
32
33
34
35
36
37
38
39
40
41
42
43
44
45
46
47
48
49
50
51
52
53
54
55
56
57
58
59
60
61
62
63
64
65
66
67
68
69
70
71
72
73
74
75
76
77
78
79
80
81
82
83
84
85
86
87
88
89
|
apiVersion: v1
kind: ConfigMap
metadata:
  name: php-benchmark-fpm-conf
  namespace: default
data:
  www.conf: |
    [www]
    user = www-data
    group = www-data
    listen = 127.0.0.1:9000

    pm = static
    pm.max_children = 10
    pm.max_requests = 200
    pm.status_path = /status

---

apiVersion: apps/v1
kind: Deployment
metadata:
  name: php-fpm-benchmark-php
  namespace: default
  labels:
    app: php
spec:
  replicas: 2
  selector:
    matchLabels:
      app: php
  template:
    metadata:
      labels:
        app: php
    spec:
      containers:
        - name: php
          lifecycle:
            postStart:
              exec:
                command: ["/bin/sh", "-c", "cp -r /app/. /var/www/html"]
          image: kyue1005scmp/php-fpm-benchmark-php
          resources:
            limits:
              cpu: 50m
              memory: 128Mi
            requests:
              cpu: 50m
              memory: 50Mi
          volumeMounts:
            - name: php-fpm-conf
              mountPath: /usr/local/etc/php-fpm.d/www.conf
              subPath: www.conf
        - name: php-fpm-exporter
          image: hipages/php-fpm_exporter
          env:
            - name: PHP_FPM_SCRAPE_URI
              value: tcp://127.0.0.1:9000/status
          ports:
            - containerPort: 9253
          resources:
            limits:
              cpu: 30m
              memory: 32Mi
            requests:
              cpu: 10m
              memory: 10Mi
      volumes:
        - name: php-fpm-conf
          configMap:
            name: php-benchmark-fpm-conf
---
apiVersion: v1
kind: Service
metadata:
  name: php-benchmark-php
  namespace: default
  labels:
    app: php
  annotations:
    prometheus.io/scrape: 'true'
    prometheus.io/port: '9253'
spec:
  selector:
    app: php
  ports:
    - protocol: TCP
      port: 9000
|
In the above manifests, we defined the configmap for our simple benchmarking app. Here we added exporter as sidecar (line: 55-68) and exposed it with service.
Also note that we have added two annotations (line: 81-83) for Prometheus in the service manifest. Those annoatations are necessary for Prometheus to scrape the data from the exporter.
Deploy nginx application running with PHP-FPM app#
Next, we will deploy Nginx application which will pass all the PHP requests to the PHP-FPM pod.
 1
 2
 3
 4
 5
 6
 7
 8
 9
10
11
12
13
14
15
16
17
18
19
20
21
22
23
24
25
26
27
28
29
30
31
32
33
34
35
36
37
38
39
40
41
42
43
44
45
46
47
48
49
50
51
52
53
54
55
56
57
58
59
60
61
62
63
64
65
66
67
68
69
70
71
72
73
74
75
76
77
78
79
80
81
82
83
84
85
86
87
88
89
90
91
92
93
94
95
96
97
98
99
|
apiVersion: v1
kind: ConfigMap
metadata:
  name: php-benchmark-nginx-conf
  namespace: default
data:
  nginx.conf: |
    pid        /tmp/nginx.pid;

    events {
        worker_connections  1024;
    }

    http {
      client_body_temp_path /tmp/client_temp;
      proxy_temp_path       /tmp/proxy_temp_path;
      fastcgi_temp_path     /tmp/fastcgi_temp;
      uwsgi_temp_path       /tmp/uwsgi_temp;
      scgi_temp_path        /tmp/scgi_temp;
      proxy_ignore_client_abort on;

      server {
        listen 8080 default_server;
        listen [::]:8080 default_server;
        proxy_ignore_client_abort on;
        root /var/www/html;
        server_name _;

        location / {
          try_files $uri $uri/ =404;
        }

        location ~ \.php$ {
          include fastcgi_params;
          proxy_ignore_client_abort on;
          fastcgi_buffers 16 32k;
          fastcgi_buffer_size 32k;
          fastcgi_intercept_errors on;
          fastcgi_read_timeout 900;
          fastcgi_keep_conn on;
          fastcgi_param REQUEST_METHOD $request_method;
          fastcgi_param SCRIPT_FILENAME $document_root$fastcgi_script_name;
          fastcgi_pass php-benchmark-php:9000;
        }
      }
    }

---

apiVersion: apps/v1
kind: Deployment
metadata:
  name: php-fpm-benchmark-nginx
  namespace: default
  labels:
    app: nginx
spec:
  replicas: 2
  selector:
    matchLabels:
      app: nginx
  template:
    metadata:
      labels:
        app: nginx
    spec:
      containers:
        - name: nginx
          image: kyue1005scmp/php-fpm-benchmark-nginx
          resources:
            limits:
              cpu: 100m
              memory: 128Mi
            requests:
              cpu: 10m
              memory: 50Mi
          volumeMounts:
            - name: nginx-conf
              mountPath: /etc/nginx/nginx.conf
              subPath: nginx.conf
      volumes:
        - name: nginx-conf
          configMap:
            name: php-benchmark-nginx-conf
---
apiVersion: v1
kind: Service
metadata:
  name: php-benchmark-nginx
  namespace: default
  labels:
    app: nginx
spec:
  selector:
    app: nginx
  ports:
    - protocol: TCP
      port: 8080
---
|
As we can see at line 33-44, nginx will pass all the PHP requests to the FPM pod.
If you deploy those manifests, our application is ready to get connection.
Next we need to deploy VMServiceScrape resource in order to tell VictoriaMetrics to scrape the data from the exporter. Apply the following manifest
 1
 2
 3
 4
 5
 6
 7
 8
 9
10
11
12
13
14
15
|
apiVersion: operator.victoriametrics.com/v1beta1
kind: VMServiceScrape #scrape based on service. There is also VMNodeScrape
metadata:
  name: php-benchmark-fpm
  namespace: monitoring #namespace where VictoriaMetrics deployed
spec:
  endpoints:
  - targetPort: 9253
    path: /metrics
  namespaceSelector:
    matchNames:
    - default  #app deployed in default namespace
  selector:
    matchLabels:
      app: php #PHP-FPM svc has this label. Label should match
|
Test the configuration#
Let’s test whether the above deployments are working correctly or not, we will deploy another pod and test the connectivity
1
|
kubectl run httpd --image=httpd -it --rm --restart=Never -- /bin/bash
|
Next, execute the following curl command while in the httpd pod:
1
|
curl http://php-benchmark-nginx:8080/bench.php?io=fast
|
Wait a few seconds. You should see a completed message. Means everything is working as expected 😎
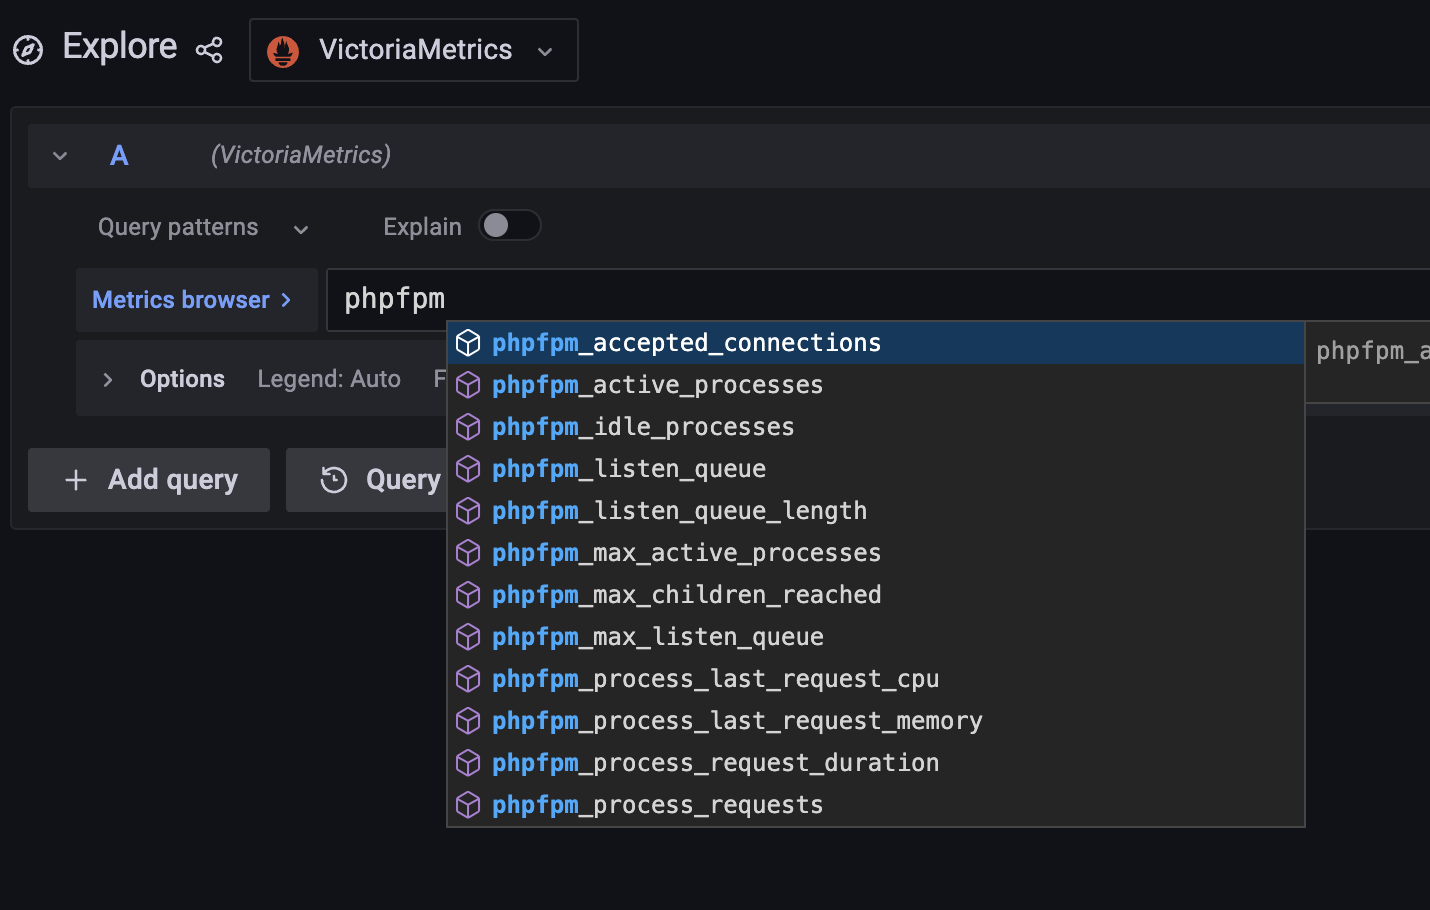
If you visit Grafana dashboard and go to Explore section, you should have phpfpm_* metrics available. Means all our above configurations are working fine 👌
Add the following dashboard in Grafana for monitoring PHP-FPM process:
https://github.com/hipages/php-fpm_exporter/blob/master/grafana/kubernetes-php-fpm.json
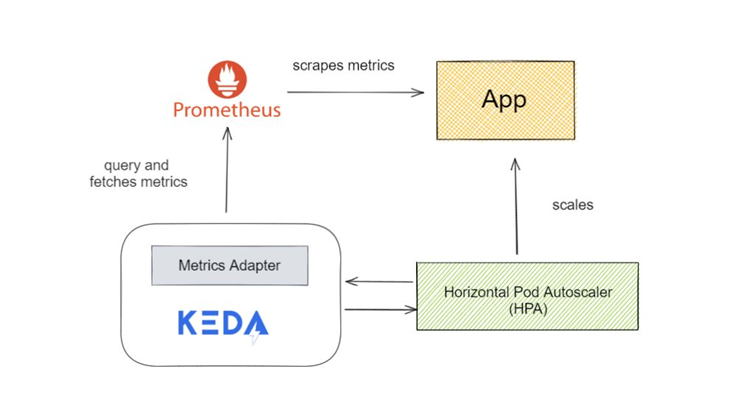
Scaling with Keda#
Keda is an Event-driven Autoscaler. Kubernetes Horizontal Pod Autoscaler is limited to few metrics. If we need more advanced metrics, like scaling pods based on php-fpm process utilization, Keda is a great choice.
Install Keda
Please follow the official documentation to deploy Keda in your Kubernetes cluster.
Next, we will deploy Keda’s ScaledObject resource in default namespace which will monitor php-fpm process utilization. Based on the utlization, we can scale pods.
 1
 2
 3
 4
 5
 6
 7
 8
 9
10
11
12
13
14
15
16
17
18
19
20
21
22
|
---
apiVersion: keda.sh/v1alpha1
kind: ScaledObject
metadata:
 name: php-fpm-scale
 namespace: default
spec:
 scaleTargetRef:
   kind: Deployment
   name: php-fpm-benchmark-php
 minReplicaCount: 3
 maxReplicaCount: 6
 cooldownPeriod: 30
 pollingInterval: 1
 triggers:
 - type: prometheus
   metadata:
     serverAddress: http://vmsingle-vmstack.monitoring.svc:8429
     metricName: phpfpm_active_processes  #Metric name to use.
     query: |
       avg((sum(phpfpm_active_processes{job="php-benchmark-php"}) by (kubernetes_pod_name) *100) / sum(phpfpm_total_processes{job="php-benchmark-php"}) by (kubernetes_pod_name))
     threshold: "50" #Value to start scaling for. Trigger scaling when the process utilization is 50%
|
At line 8-10, we are targeting php-fpm-benchmark-php deployment for the scaling event. Also at line 18 we specified the VictoriaMetrics/Prometheus service endpoint. Finally, at line 20-22, we added a custom query that will run every second (pollingInterval). This query will return the current phpfpm active process of php-fpm-benchmark-php deployment. If the value goes above 50% (threshold), scaling will happen. A minimum of 3 replicas (minReplicaCount) will always be running and Keda will scale the pods up to 6 replicas (maxReplicaCount).
Test the scaling event#
Let’s test how Keda performs scaling event. While in httpd pod
(kubectl run httpd --image=httpd -it --rm --restart=Never -- /bin/bash), run the following ab test command
1
|
ab -c 50 -n 1000 -s 1200 http://php-benchmark-nginx:8080/bench.php\\?io\\=slow
|
The above command will send 1000 requests and perform 50 requests at a time. The maximum timeout is set to 1200 seconds.
Now monitor the PHP-FPM dashboard in Grafana and also monitor pods (watch kubectl get pods). You should see pods scaling up and down based on process utilization.
That’s all folks.